Learn the Most Critical Part of an Analytics Audit
Auditing your website analytics can seem daunting at first. Just as when people use an app analytics tool, there are many questions to ask. Where do you start? What should you focus on? What process should you follow? How do you decide when something is really broken? Or if it’s okay but could be better?
We previously shared our AUDIT framework to help answer these questions as you perform an analytics audit and seek to discover gaps in your data, whether you’re using Adobe Analytics, Google Analytics, or a different web monitoring tool. We’d like to now share some tips, tricks, and things to remember when checking data collected from your analytics code and tags.
Check Your Tracking Calls in Google Analytics and Adobe Analytics
The most critical part of any analytics audit is making sure that analytics tracking calls send the right data. It doesn’t matter how much analytics code is on your site if it’s not sending the right data in the right format at the right time to the right analytics platform.
To make sure tracking calls are present and accurate, we use specialized debugging tools such as Charles and Fiddler. However, your browser’s developer tools and other browser add-ons can be just as efficient. In Chrome for example, navigate through the triple-dot settings menu in the upper-right corner of the browser to access “More Tools” and then “Developer Tools.” Alternatively, you can right-click on your website and select “Inspect” to access the Chrome Developer Tool as shown below:

Once in the developer tool, click on the “Network” tab. Click the “Preserve log” option, as shown in the screenshot below, to record the sequence of analytics calls as you navigate through your website and interact with different elements. You’ll need to reload the page when you first get started to see tracking calls associated with the initial page load.
This method can be used to check tracking calls for the Adobe Marketing Cloud, Google Analytics Standard or Google Analytics 360, and other analytics tools. You just have to know what to filter on.
For Google Analytics, filter on “collect?v” like so:

Keep in mind that filtering on “collect?v” will also show tracking calls for other Google services like Doubleclick, since they use similar tracking URL formats. If you get creative with your filter, you can get down to just Google Analytics tracking calls. For example, you can search for the longer phrase “google-analytics.com/r/collect?v” to see just Google Analytics calls. If you need help deciphering the different values in the Google tracking call, check out the Google Analytics Measurement Protocol Parameter Reference help article.
You can also install the Google Tag Assistant browser extension to record a session of all Google Analytics tracking calls. This tool will show you both what the tracking calls look like when they send to Google Analytics and also how that data looks when processed by Google Analytics into reports.
For Adobe Analytics, filter on “b/ss” as follows:

This support article on Data Collection Query Parameters from Adobe will help you decipher the values available in an Adobe Analytics tracking call. Keep in mind that since Adobe’s strength is customized analytics tracking, most of the variables in the tracking call are going to be custom to your implementation. We recommend keeping your variable map or solution design reference close by so you know what each custom prop or evar shown in the tracking call represents.
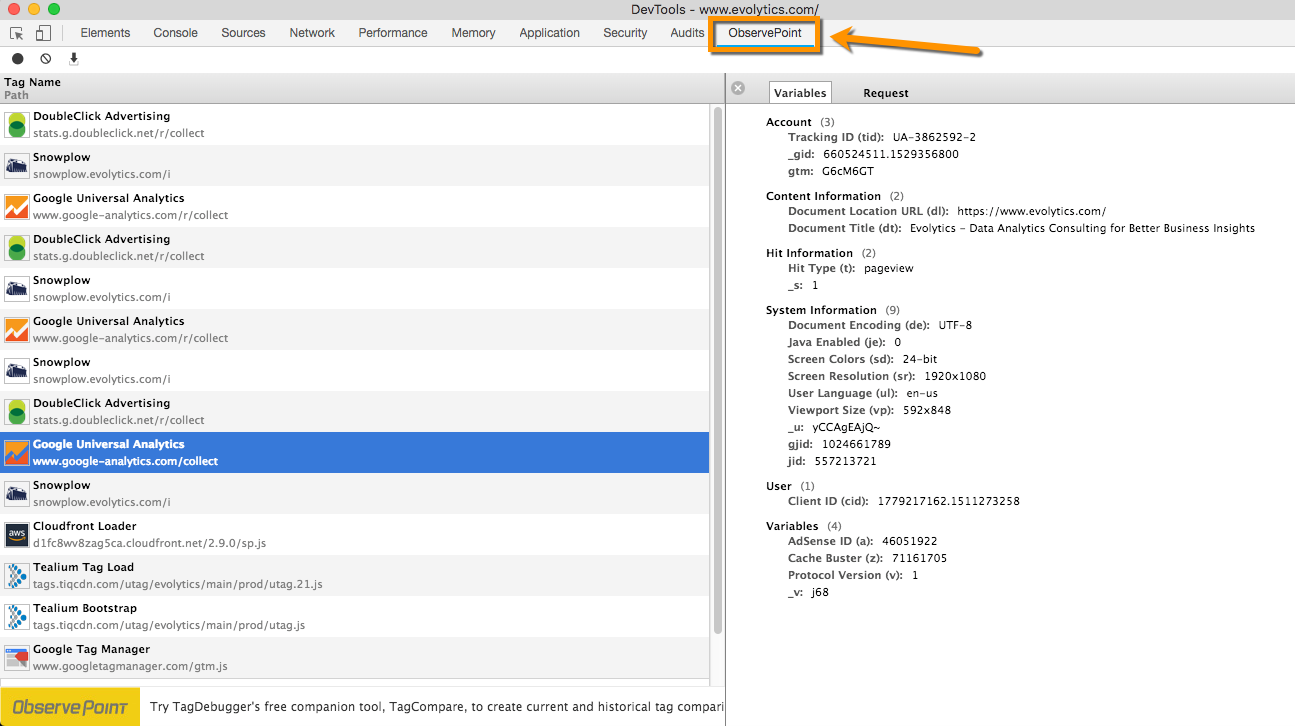
Observepoint, one of our solution partners, offers a great browser-based extension called TagDebugger that helps easily interpret analytics tracking calls from many platforms. After installing the Chrome extension, you then access the tool similar to accessing the Network tab. You’ll have a new tab called “Observepoint” on your developer tool window to easily check analytics calls.
The ObservePoint TagDebugger is also helpful when an analytics call payload is so big that it sends as a POST request instead of a GET request. If this happens, TagDebugger will automatically parse out analytics variables from the POST request into a cleaner view.
We recommend checking tracking calls related to key pages, key flows, and key metrics – basically the things that matter most to your site and your measurement plan. When we conduct an audit for a client, we use the Align phase of our AUDIT framework to understand strategic goals, key metrics, analytics pain points, measurement needs, and past data anomalies to help guide the audit.
Check Your Campaign Tracking
No matter what analytics tool you use, you’re likely tagging inbound URLs from advertising and marketing initiatives with campaign tracking parameters, such as “utm” values for Google Analytics or a “cid” value for Adobe Analytics.
When auditing your analytics, make sure to test tagged campaign URLs and check that the campaign data populates in the tracking call as expected. You can test actual campaign URLs, perhaps from your ad server or email platform. You can also make up your own test parameters and look for those in the tracking calls. If you use a custom parameter for testing, you can then filter using that value later in your analytics platform to see data related to your specific visit for additional QA.
When checking tracking calls for Google Analytics in the Network tab, keep in mind that the tracking call will not break out your query string utm parameters into their own values. However, if you use the Google Tag Assistant recording feature, you can use the “Google Analytics Report” feature, which lets you process collected data according to the rules present in one of your Google Analytics reporting views. You can then see utm parameters broken out as individual values, like so:

The cid is easier to pick out of a network call for Adobe Analytics. If you use Adobe Analytics, you are most likely setting cid as the v0 variable, as shown here:

Keep in mind though that if you use dynamic variables to populate any variables like the Adobe website is doing for v0 in this example, you’ll need to go check the original variable as well for accuracy.
Check How Your Data Might Change
Just because a tracking call sends data one way, it doesn’t necessarily mean that data will report the exact same way in your analytics platform. As explained earlier, you can use a custom campaign parameter to isolate your test visit in analytics reports to confirm that tracking call data displays in your analytics tool as expected.
If you find discrepancies in how data looks in the tracking call compared to how it reports in your analytics tool, make sure to check your filters or processing rules. For Google Analytics, you may also need to check how custom dimensions are scoped to understand how they will report in the tool. For Adobe Analytics, you may need to check variable configuration such as allocation and expiration for the same reason. Depending on how all these settings are configured, data could be transformed in some way after the tracking call or displayed differently in the reporting tool.
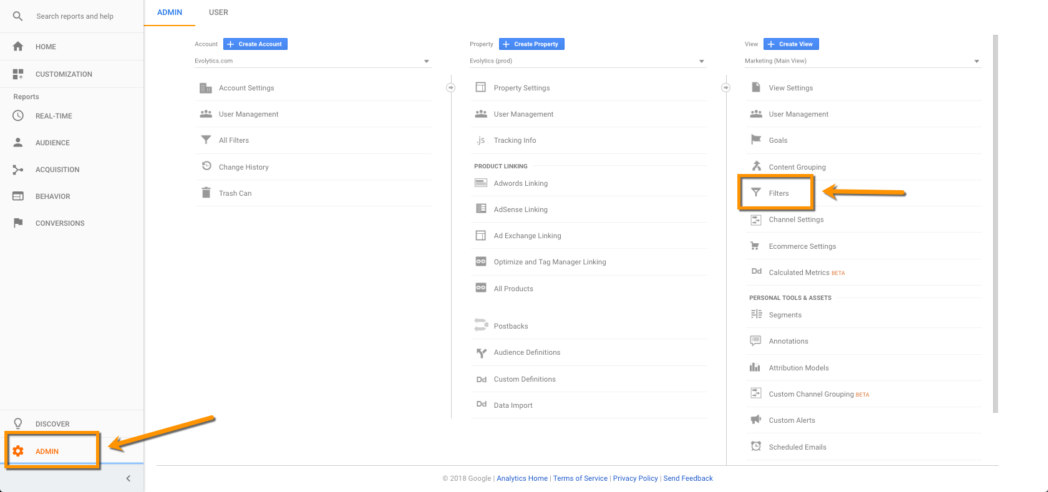
In the Google Analytics Admin section, check your view filter settings, to see if any variables are being adjusted as data feeds in from analytics tags.
For example, you might have a view filter that converts all instances of “eml” in the UTM medium value to “email” so that you can consolidate how two different email management tools classify that variable in click-through URLs, which might look like this:

You’ll need to know this transformation is taking place in case you are trying to validate the right campaign medium value is being passed from a tracking call to analytics reports.
In the Adobe Analytics Admin section, make sure to check Processing Rules within the Report Suites manager to see if data is being transformed on its way into Adobe Analytics.
On a side note, we typically do not recommend using filters or processing rules to change data on its way into an analytics tool because it makes it harder to QA and validate from tracking calls all the way to reports. We recommend fixing data issues at the point of data collection whenever possible. Only use filters or processing rules to adjust data going into your analytics tool when absolutely necessary or as a temporary stop-gap measure.
We hope these tips and tricks equip you with a few more tools to validate, fix, and enhance your analytics tracking. If you find any issues or anomalies you’d like an analytics expert to check out, we’d love to help. Also, if all of this sounds awesome but you need a partner to perform an analytics data audit instead, we can help with that too.
Written By

Chase Porter
Chase Porter, Director of Data Operations, guides clients through the process of accessing, visualizing, and sharing data. His primary specialty is integrating, visualizing, and analyzing data from numerous systems to assess multi-channel program effectiveness and optimize conversion performance. He also provides analytical thinking and strategic guidance supporting performance analysis and program optimization for clients such as St.Jude/ALSAC, LogMeIn, and Intuit. Chase was nominated as a 2019 DAA Difference Maker Finalist.