The Measurement Blog is curated content from the Evolytics staff, bringing you the most interesting news in data and analysis from around the web. The Evolytics staff has proven experience and expertise in analytics strategy, tagging implementation, data engineering, and data visualization.
WHY DOMINO’S DELIVERS MORE THAN 15 WAYS TO ORDER PIZZA
GOOGLE ANALYTICS SOLUTIONS | BLOG
As technology evolves, so do customer expectations, and successful businesses adapt to deliver. Domino’s is one such case study.
Five years ago, the web-based ordering process was more than 25-steps long, a cumbersome process that lost many customers in the funnel. The company innovated, creating profiles and simplifying the customer journey to include only five steps. The streamlined customer experience lead to an increase in conversions.
Domino’s explains that they didn’t make all of these optimizations at once, but rather by “running lots of small-scale projects and learning along the way how to make better customer experiences. We’d rather launch 50 small innovations over two years than spend the same time developing one big project.”
The Testing and Optimization team at Evolytics agrees with this notion of rapidly iterating ideas that lead to quick insights and improvements while making a positive impact to the overall conversion process along the way. While identifying “big bets” is important, creating a culture around testing and empowering teams to identify and test small optimizations is more valuable for businesses aiming to get a strong ROI from their testing practice.
SOLAR ECLIPSE 2017 DATA MAPS
TWITTER | COLLECTION
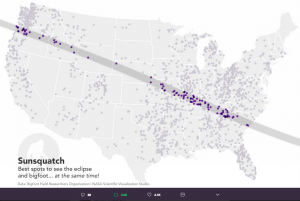
Were you fascinated with the total eclipse on Monday? The Evolytics office was along the path of totality, so we opened up our offices to celebrate the historic event with family and friends – cheesy eclipse burgers and moon pies included.
In true nerd fashion, we broadcasted the NASA channel and shared our favorite eclipse-themed data visualizations. @Jscarto posted one of our favorite collections of fun, data-driven eclipse maps.
If you’re sorry you missed out on all this nerdiness, check out our career opportunities and find out how you can join our team of collaborative, fun-loving analytics professionals.
TABLEAU ACQUIRES NATURAL LANGUAGE QUERY STARTUP CLEARGRAPH
TABLEAU | PRESS RELEASE
Tableau recently announced its acquisition of ClearGraph, a Palo Alto startup specializing in natural language query technology. This move follows an industry trend toward allowing users to speak to their data and ask questions naturally.
“We are thrilled to bring the ClearGraph team to Tableau to enable people to ask questions of their data using natural language,” said Francois Ajenstat, Chief Product Officer at Tableau. “Natural language queries will make it easier for more people to interact with Tableau, whether you’re an executive who needs an answer quickly, or on a mobile phone and want an answer from your data on the move. We’re excited about this acquisition as the ClearGraph team shares our mission and is aligned with our innovation perspectives on conversational analytics.”
At Evolytics, we look forward to the development of this technology and how it will help organizations evolve analytics through ease of data access for non-technical stakeholders. In the meantime, our award-winning Data Visualization team does an amazing job making data “talk” to analysts and non-analysts alike.
Written By

Evolytics
This post is curated content from the Evolytics staff, bringing you the most interesting news in data and analysis from around the web. The Evolytics staff has proven experience and expertise in analytics strategy, tagging implementation, data engineering, and data visualization.