Blog


Sharing analytics tips, expert advice and industry insights.

Tableau 201: 3 Creative Ways to Use Dashboard Actions

Dashboard actions, filters, and parameters are three of the best tactics to use in Tableau because they provide a way to transfer control of the analysis from you to your end users. This is critical …

Tableau 201: How to Compare Two Date Ranges on One Axis

In the post 10 Data Viz Tips I Learned from Google Analytics, I shared that before I started using Tableau, I began my career in digital analytics using Google Analytics. One of the features I …

Data Viz Exploration: The Force Amasses (Tickets)

1/13/16 UPDATE: Since its release on December 18th, The Force Awakens has moved into 15th place in all time domestic tickets sold. This makes it the third most successful Star Wars film to date, behind 1980’s …

Tableau 201: Allow Users to Choose Measures and Dimensions

We’ve often discussed how powerful parameters are in Tableau because outside of filters and dashboard actions, they’re one of the only methods for putting control into the hands of your end users. In previous tutorials, …

Tableau 201: How to Make Small Multiple Stadium Maps

This is part three in a three-part series on mapping in Tableau. Subscribe to our Tableau tips email list in the right sidebar or at the end of this article to be alerted as soon …

How to Map Anything in Tableau

This is part two in a three part series on mapping in Tableau. Subscribe to our Tableau tips email list in the right sidebar or at the end of this article to be alerted as …

Tableau 201: How to Map a Sequential Path

This is part one in a three-part series on mapping in Tableau. Subscribe to our Tableau tips email list in the right sidebar or at the end of this article to be alerted as soon …

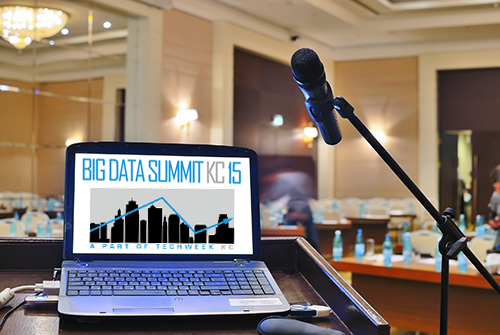
Evolytics to Present Keynote at Big Data Summit KC 2015

Evolytics’ Director of Data Visualization, Ryan Sleeper, will be presenting a keynote at Big Data Summit KC with Tableau on Wednesday, September 16th. Big Data Summit KC is an annual event that brings data enthusiasts …

Evolytics to Speak at Loves Data Analytics Conference

Evolytics is excited to announce that our own Carey Wilkins will be speaking at the Loves Data 2015 Conference in Sydney, Australia September 8 & 9 and Melbourne, Australia September 10 & 11. A lot …

Tableau Pie Chart: A Better Approach

Despite being one of the least effective means of communicating data, we often see Tableau pie charts in corporate dashboards and Tableau Public visualizations. New users likely see pie charts as an easy way to …