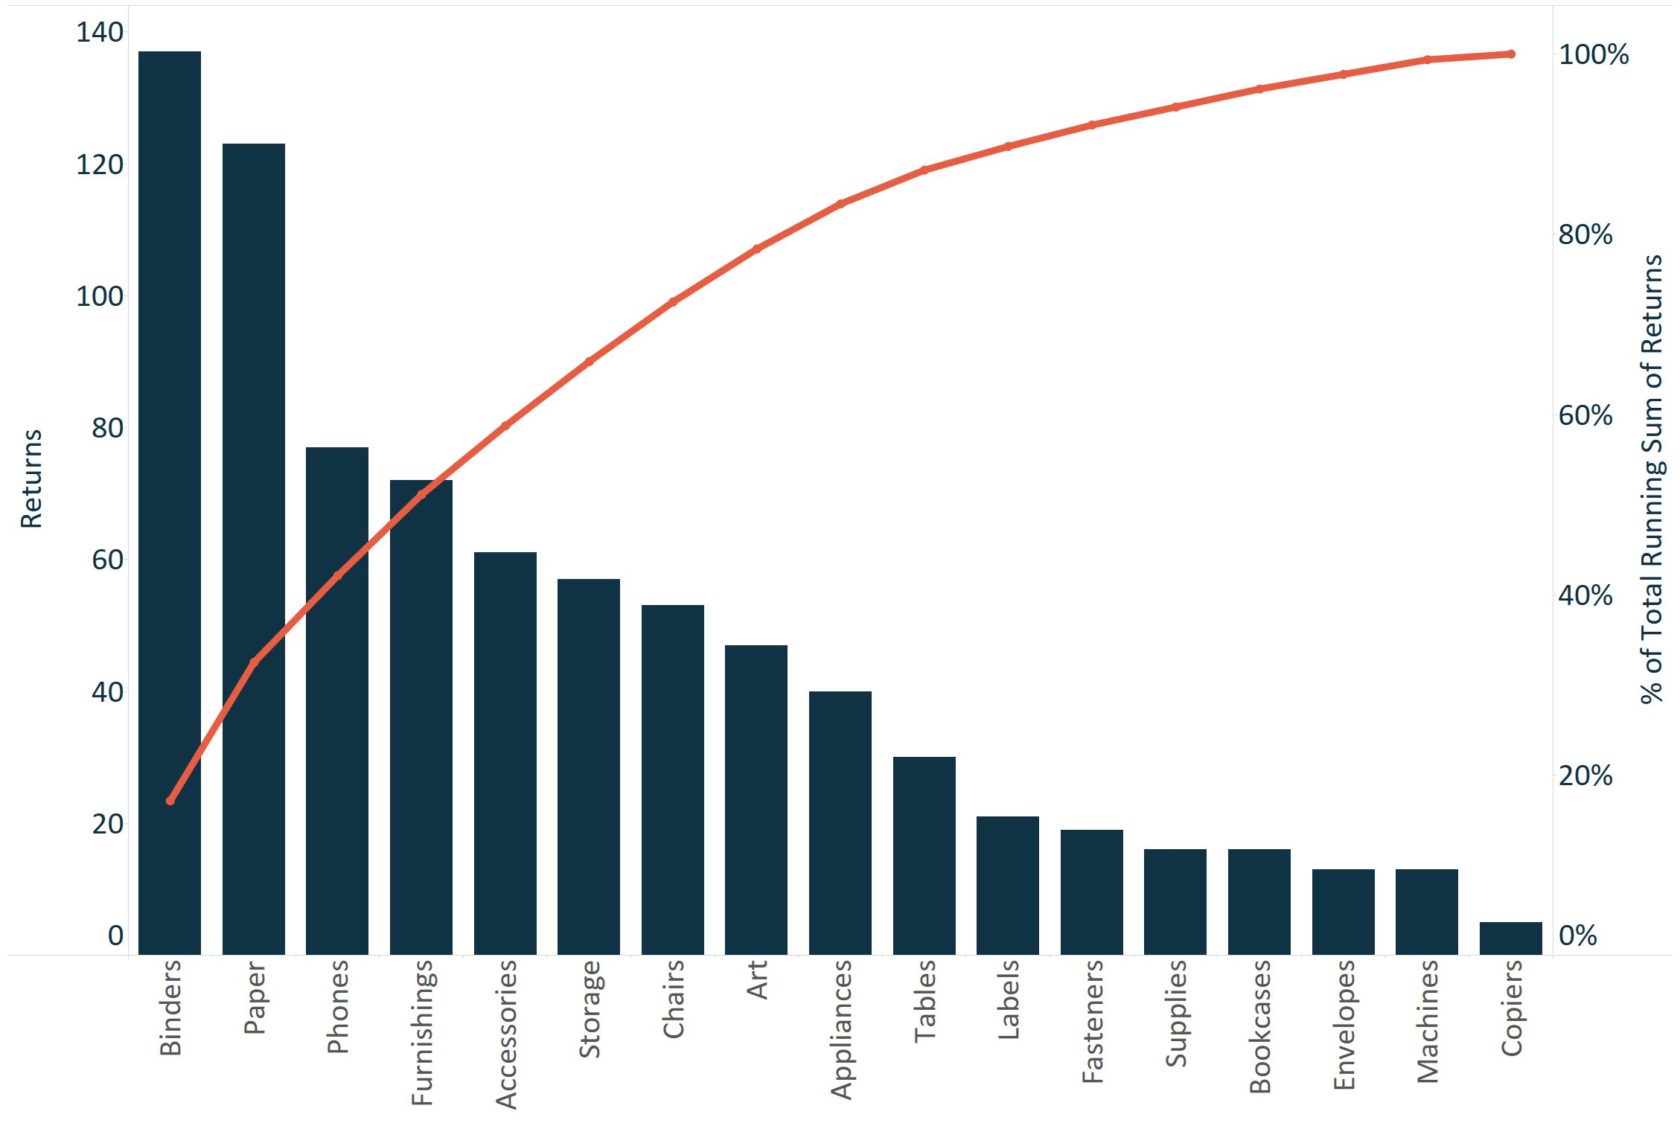
A Pareto Chart, named for Vilfredo Pareto, is a dual-axis combination chart used to highlight dimension members that are having the biggest impact to the measure in question.
On the primary axis, bars are used to show the raw quantities for each dimension member, sorted in descending order.
On the secondary axis, a line graph is used to show the cumulative total in percent format.
While this chart type can serve a variety of purposes, it is part of the seven basic tools of quality control, and is traditionally used to identify the biggest opportunities for improvement.
How to Make a Pareto Chart in Tableau
In sticking with a quality control scenario, this tutorial will use the Sample – Superstore data set to look at which product subcategories contribute the most returned items.
The final chart will look like this:
As with the rest of the Tableau 201 series, you can follow along using the Sample – Superstore data that comes with every download of Tableau.
However, this tutorial required us to take two additional steps to prepare the data.
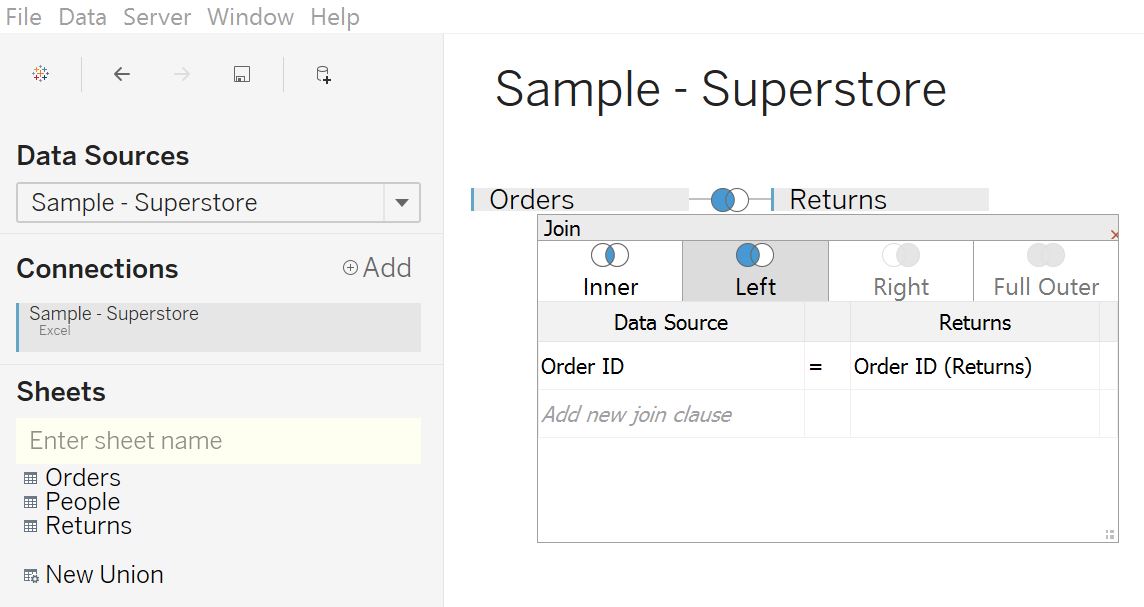
1. Left join the Returns table to the Orders table
To do this, right-click on the Sample Superstore data connection and choose “Edit data source…”.
A new interface will appear where you can drag the Returns table next to the Orders table and set up a left join on Order ID.
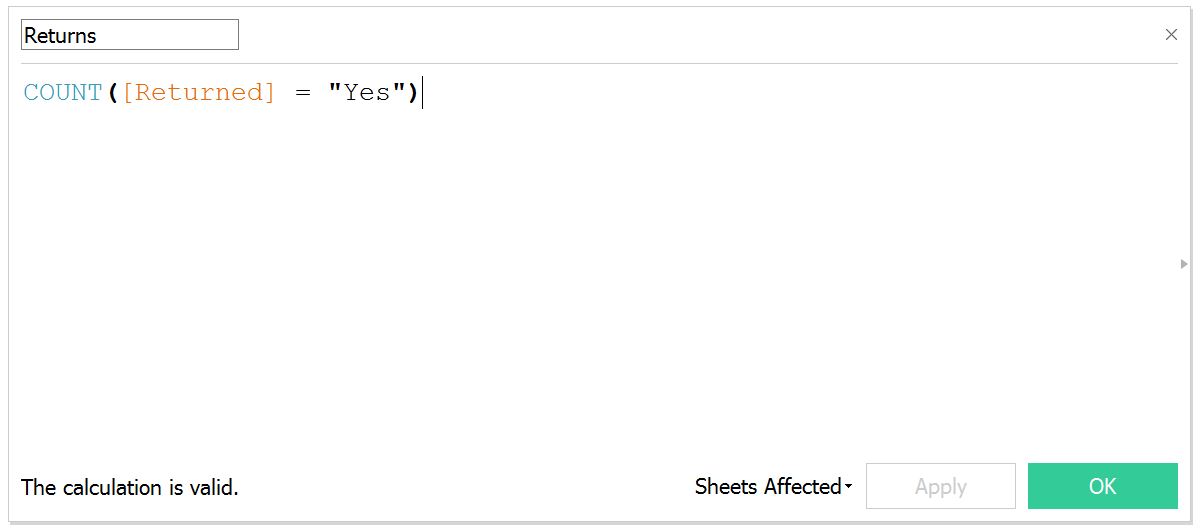
2. Create a calculated field to count the number of returns
The formula for this calculation is COUNT([Returns] = “Yes”)
We are now ready to build out the Pareto Chart.
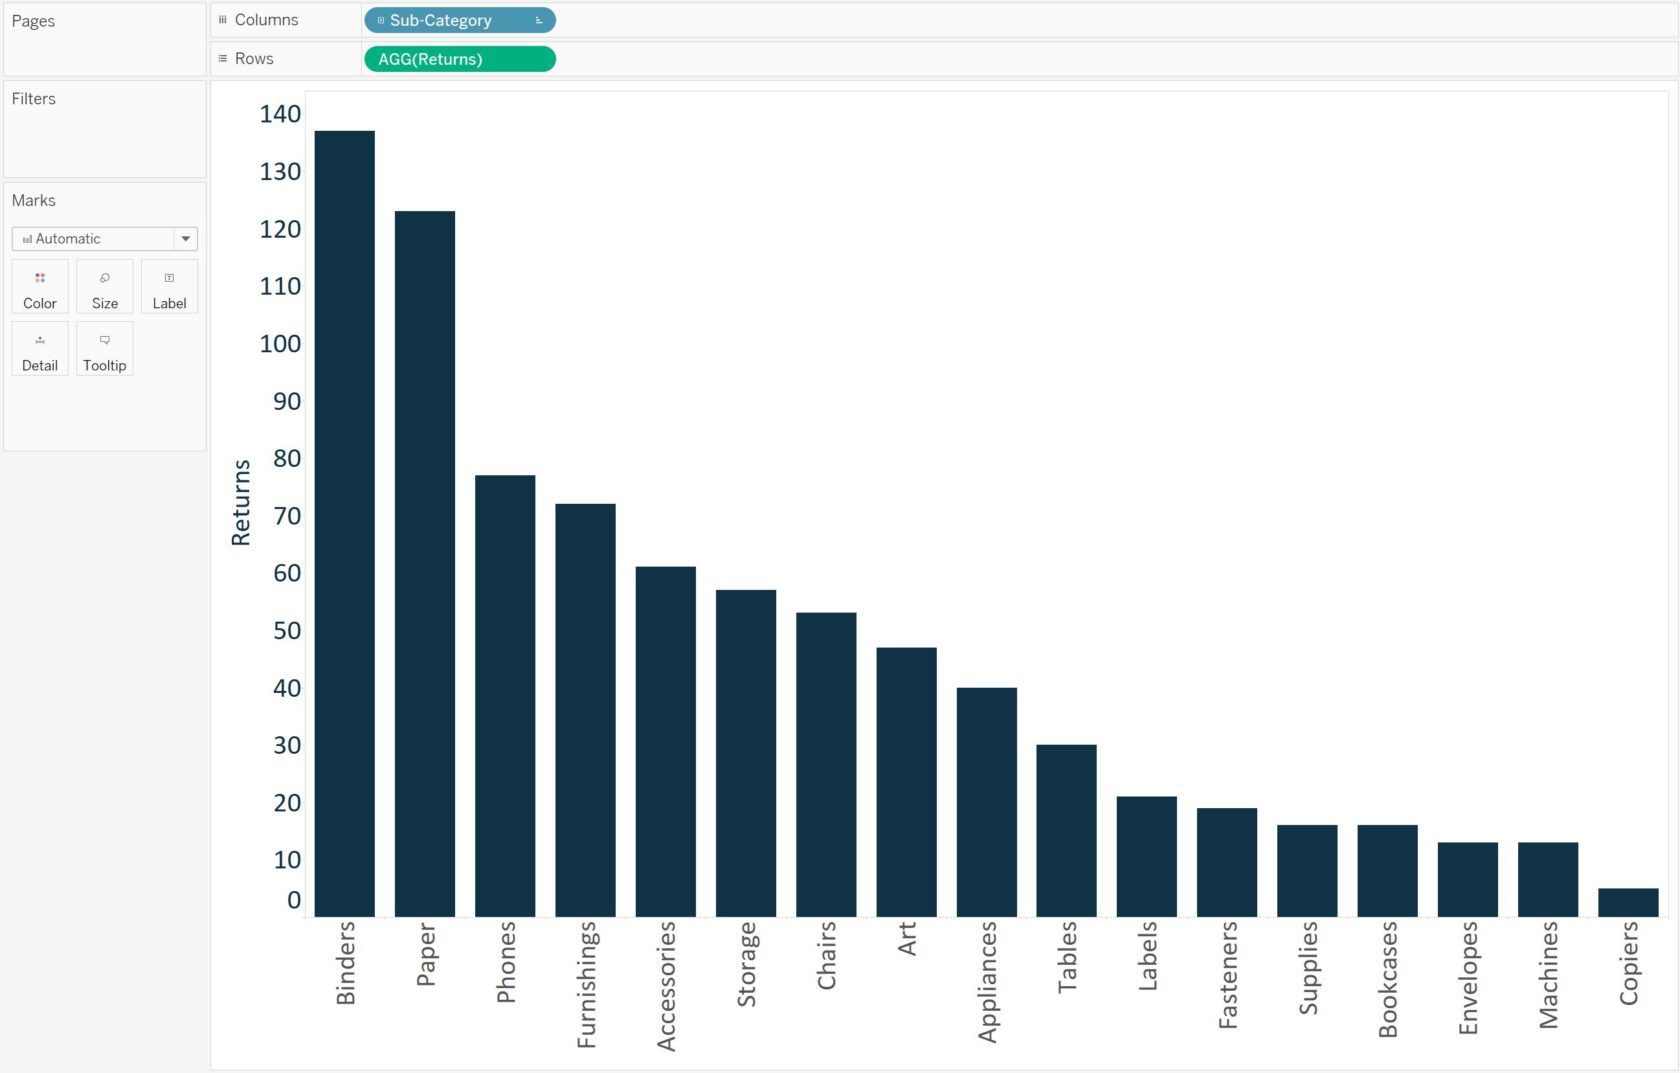
First, create a bar chart that looks at the number of returns per Product Subcategory and sort it in descending order:
Next, create a dual-axis combination chart by dragging the Returns measure from the Measure Shelf to the right axis, changing the mark type on the primary axis back to bar, and changing the mark type for the secondary axis to line.
For a refresher on creating this type of chart, see How to Make a Dual-Axis Combo Chart in Tableau.
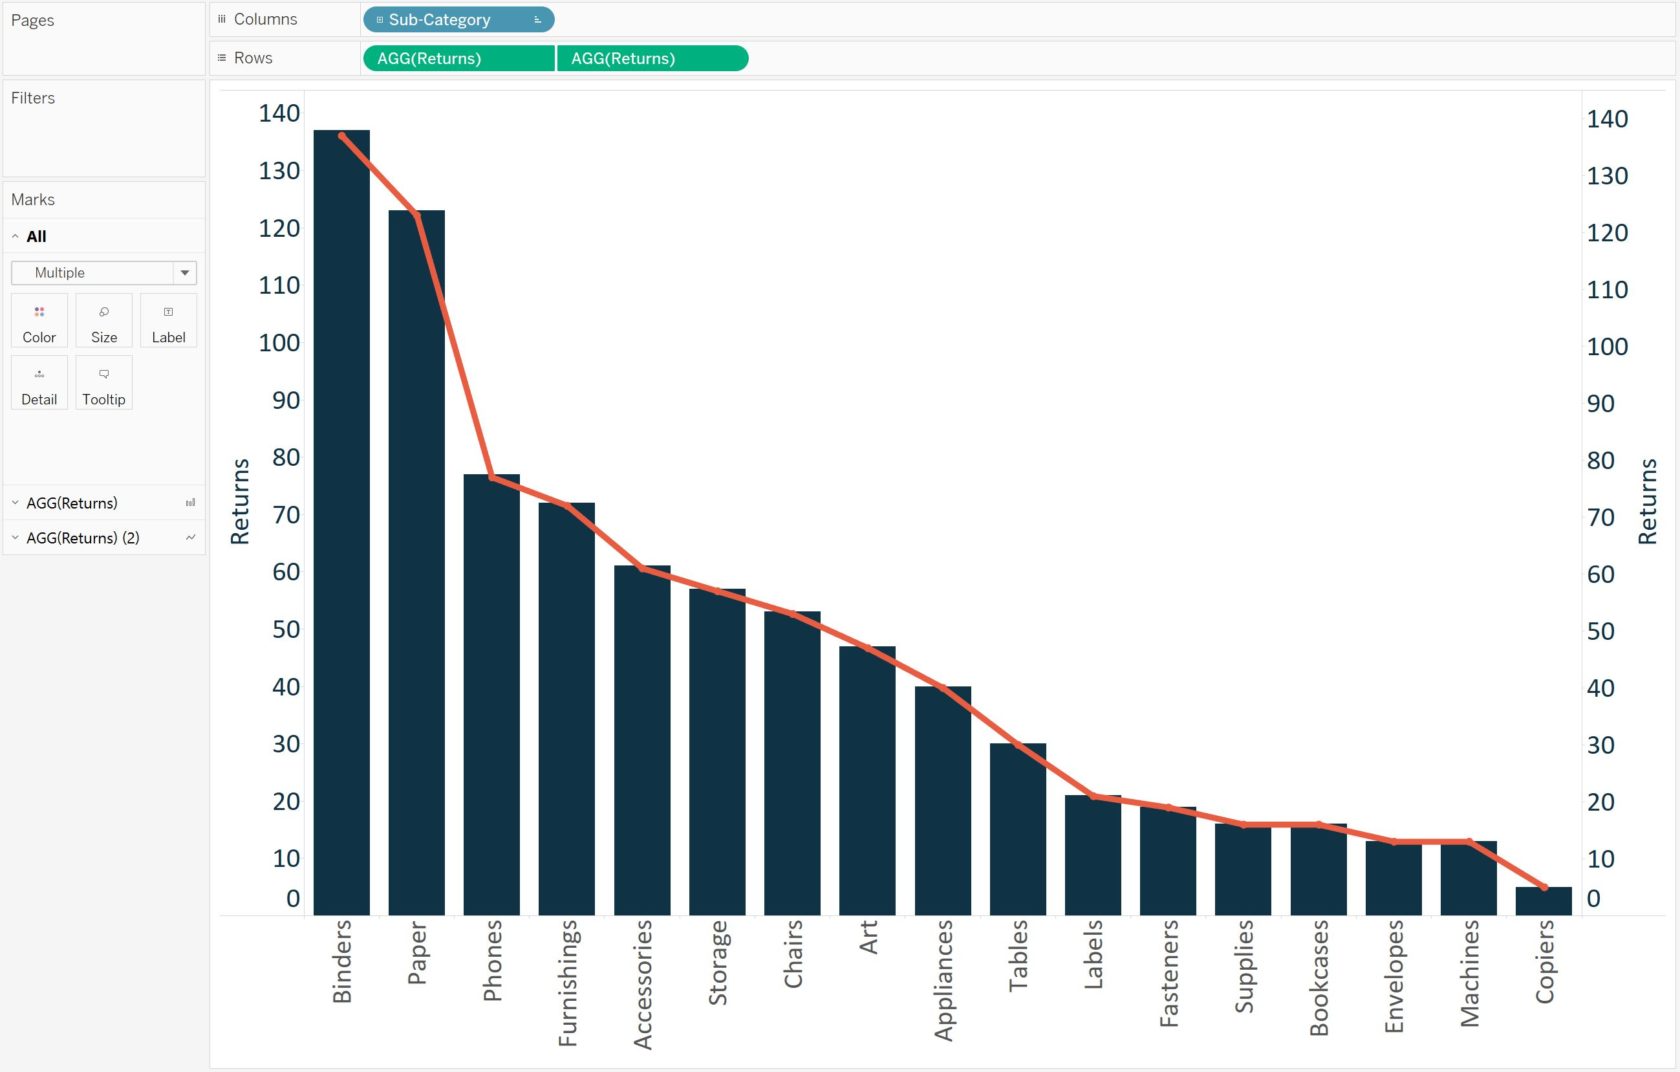
At this point, the visualization will look similar to this:
Now the step that makes this a Pareto Chart.
We will add a table calculation and a secondary table calculation to the second Returns pill to display the cumulative percent of returns across product sub-categories.
To add the first table calculation, click on the second Returns pill, hover over “Quick table calculation”, and choose “Running total”.
With the table calculation for running total, you can add a second table calculation on the result.
This is how we can calculate the raw running total number at each product sub-category, then add a secondary calculation to determine the cumulative percent of total.
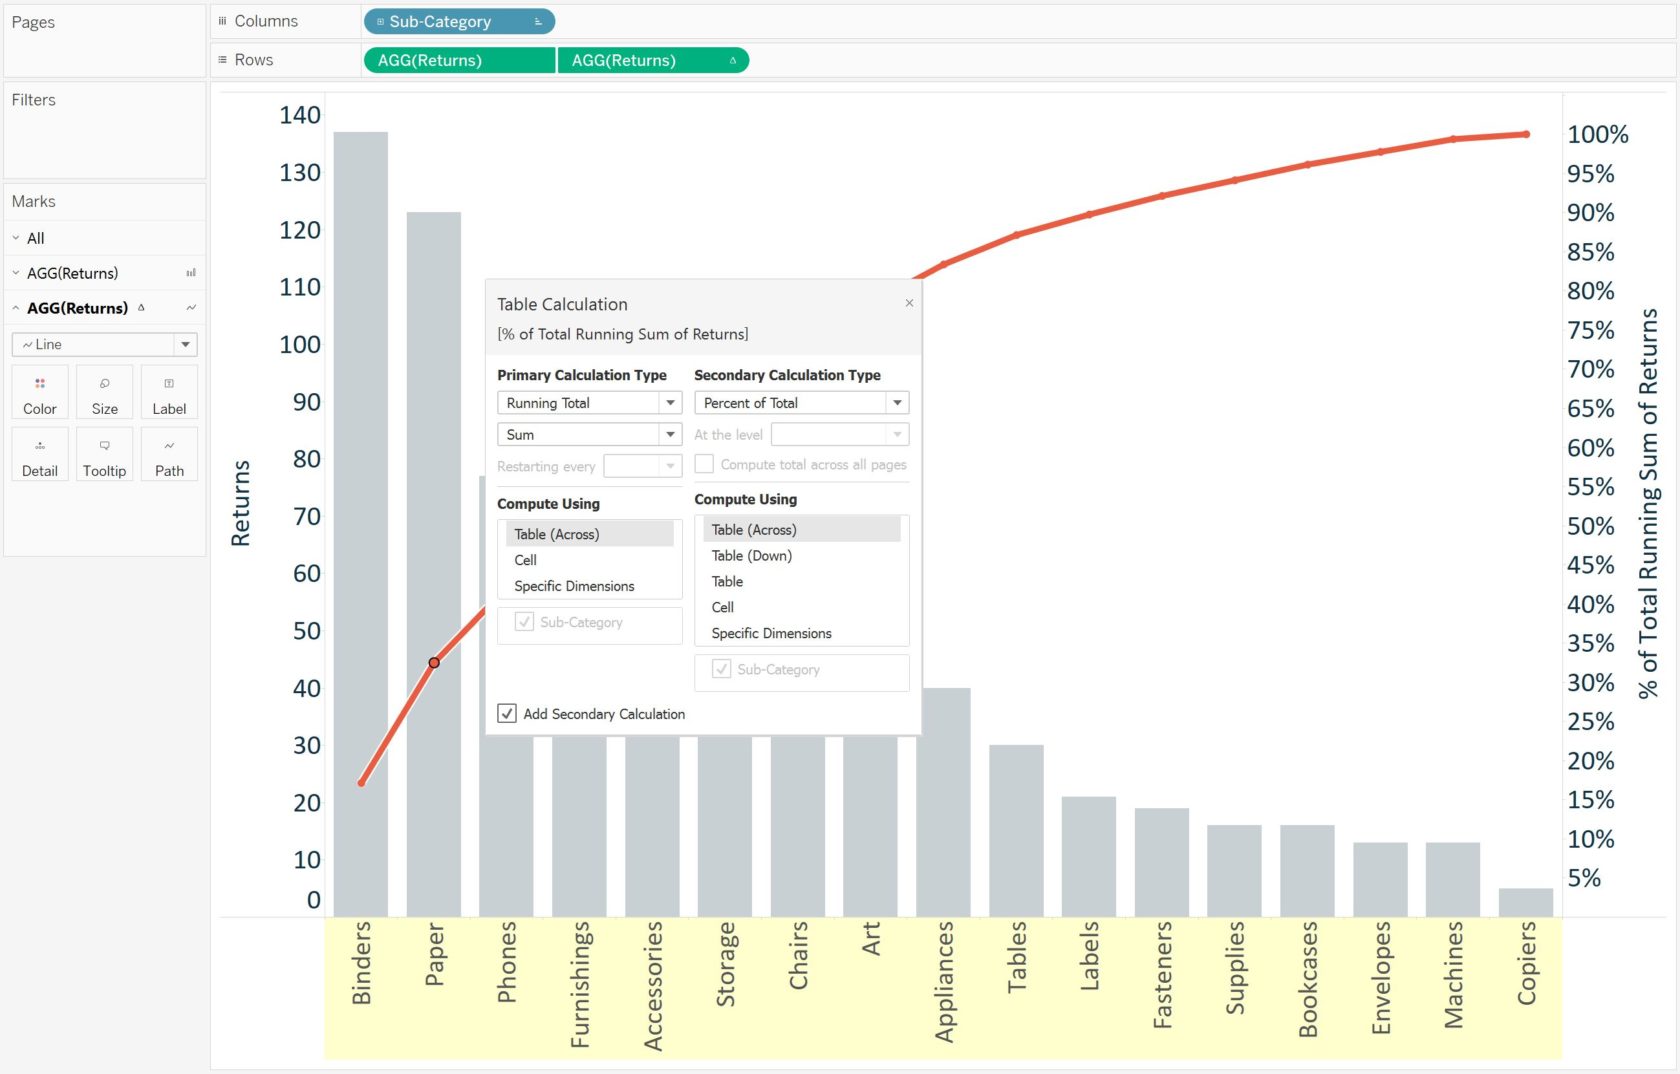
To add a secondary table calculation, click the second Returns pill again, choose “Edit table calculation…”, and check the box at the bottom of the interface that says “Add Secondary Calculation”.
Changing the Secondary Calculation Type to Percent of Total will display the cumulative percent of total.
After changing the axis tick marks for a cleaner look, we are left with this Pareto Chart:
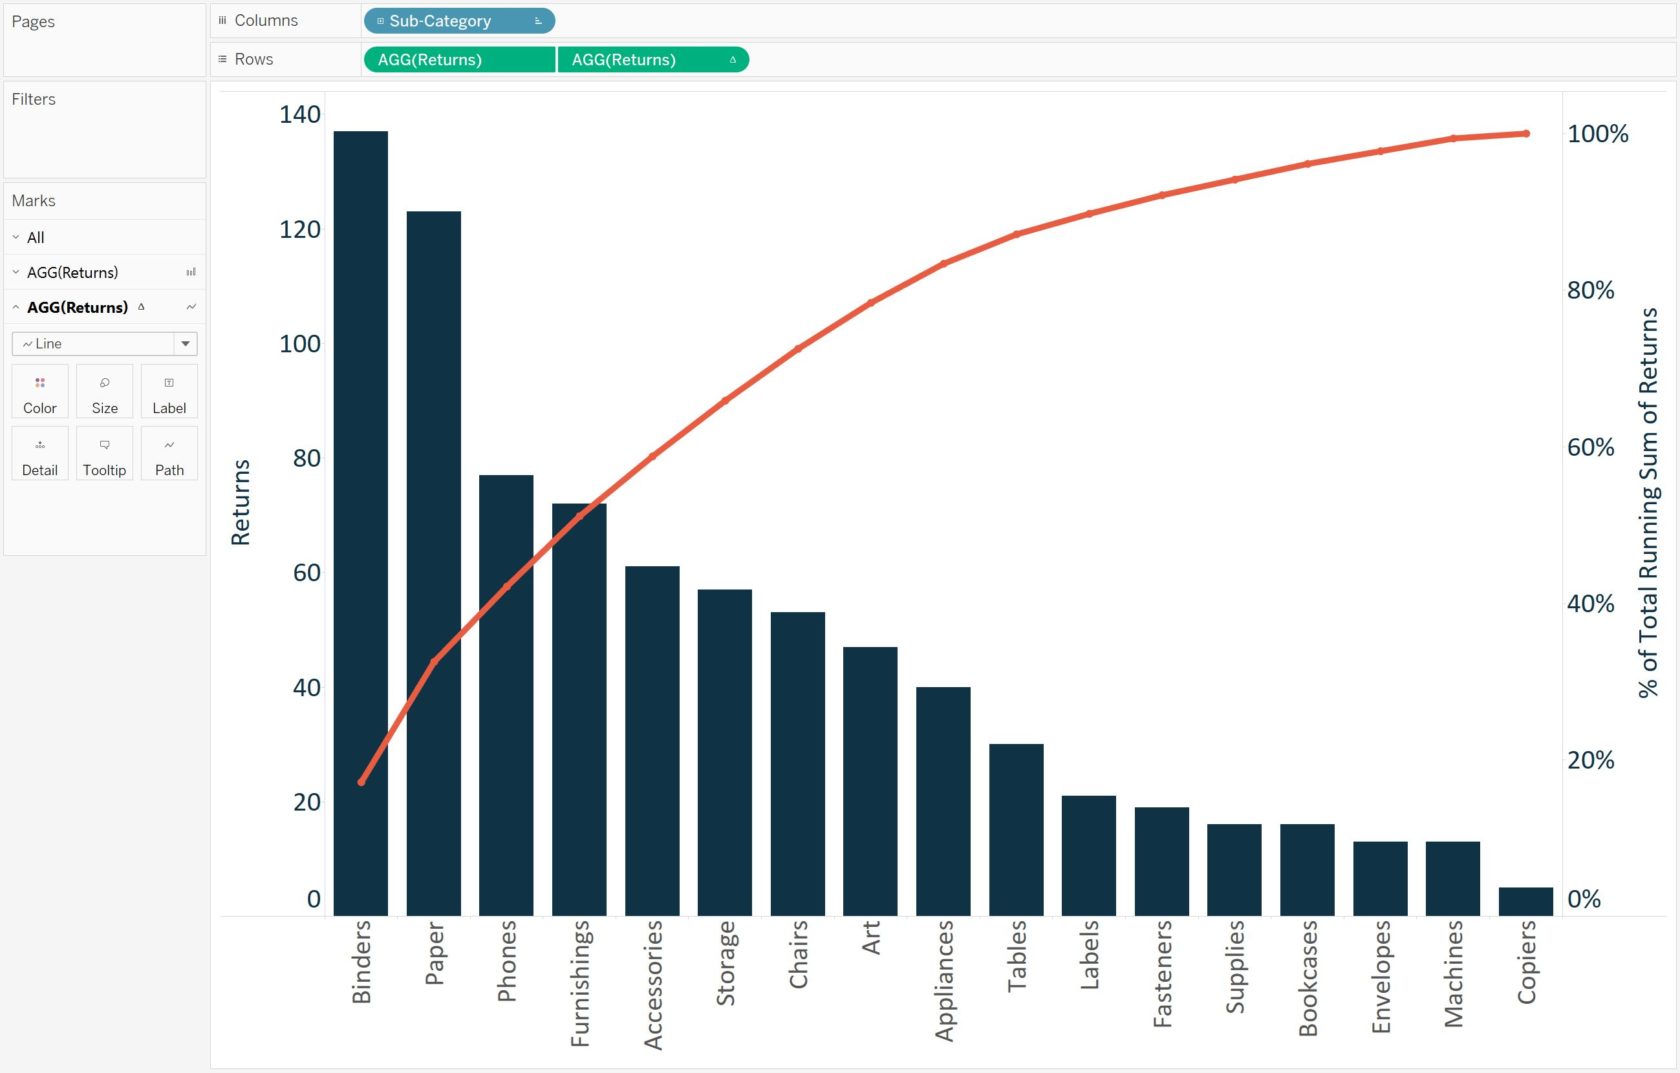
This chart can now be used for insights such as, “The business’ three most returned product sub-categories are causing about 40% of the total returns.”
Pareto Charts are an effective way to quickly highlight opportunities for improvement and provide a scale for how urgently a quality control problem should be treated.
Written By

Evolytics
This post is curated content from the Evolytics staff, bringing you the most interesting news in data and analysis from around the web. The Evolytics staff has proven experience and expertise in analytics strategy, tagging implementation, data engineering, and data visualization.