
Tableau provides the ability to filter individual views or even entire data sources on dimensions, measures, or sets. This filtering capability can serve a variety of purposes including minimizing the size of the data for efficiency purposes, cleaning up underlying data, removing irrelevant dimension members, and setting measure or date ranges for what you want to analyze. What’s more, most of these filters can be put into the hands of you and your end users to change – a powerful tactic for finding stories in the data. This post offers an introduction to filters in Tableau including extract filters, data source filters, dimension filters, and measure filters.
Dimension Filters in Tableau
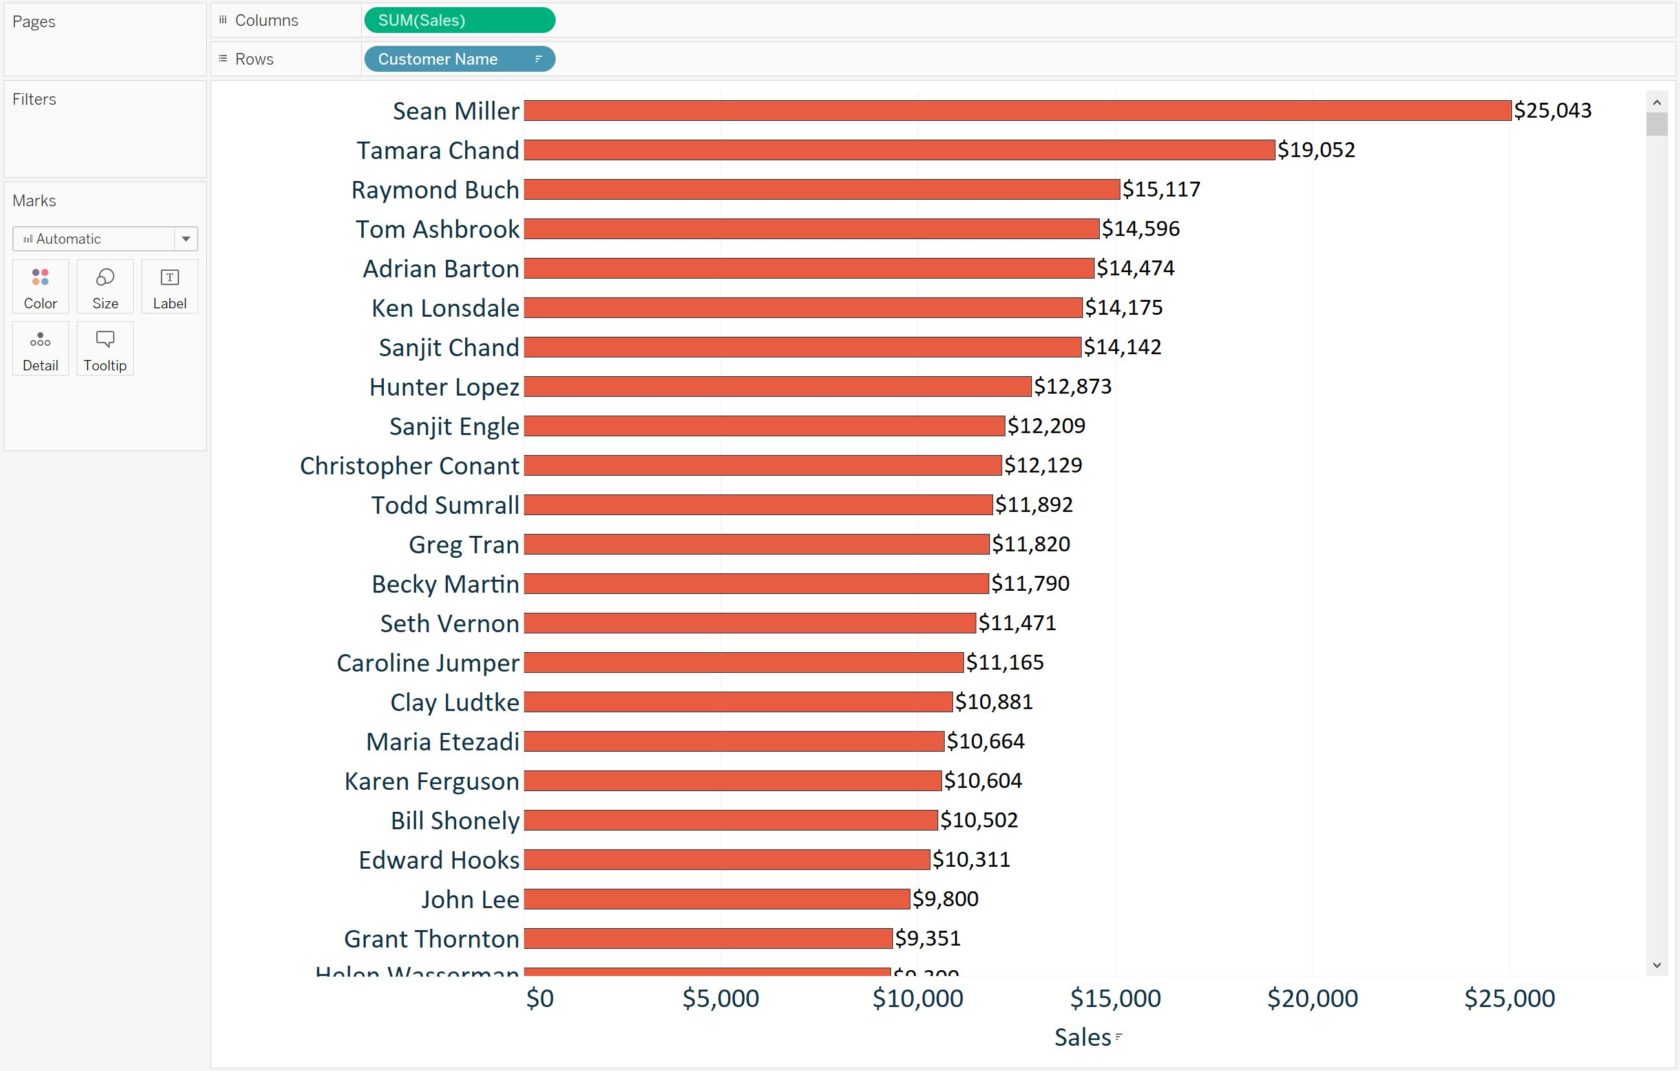
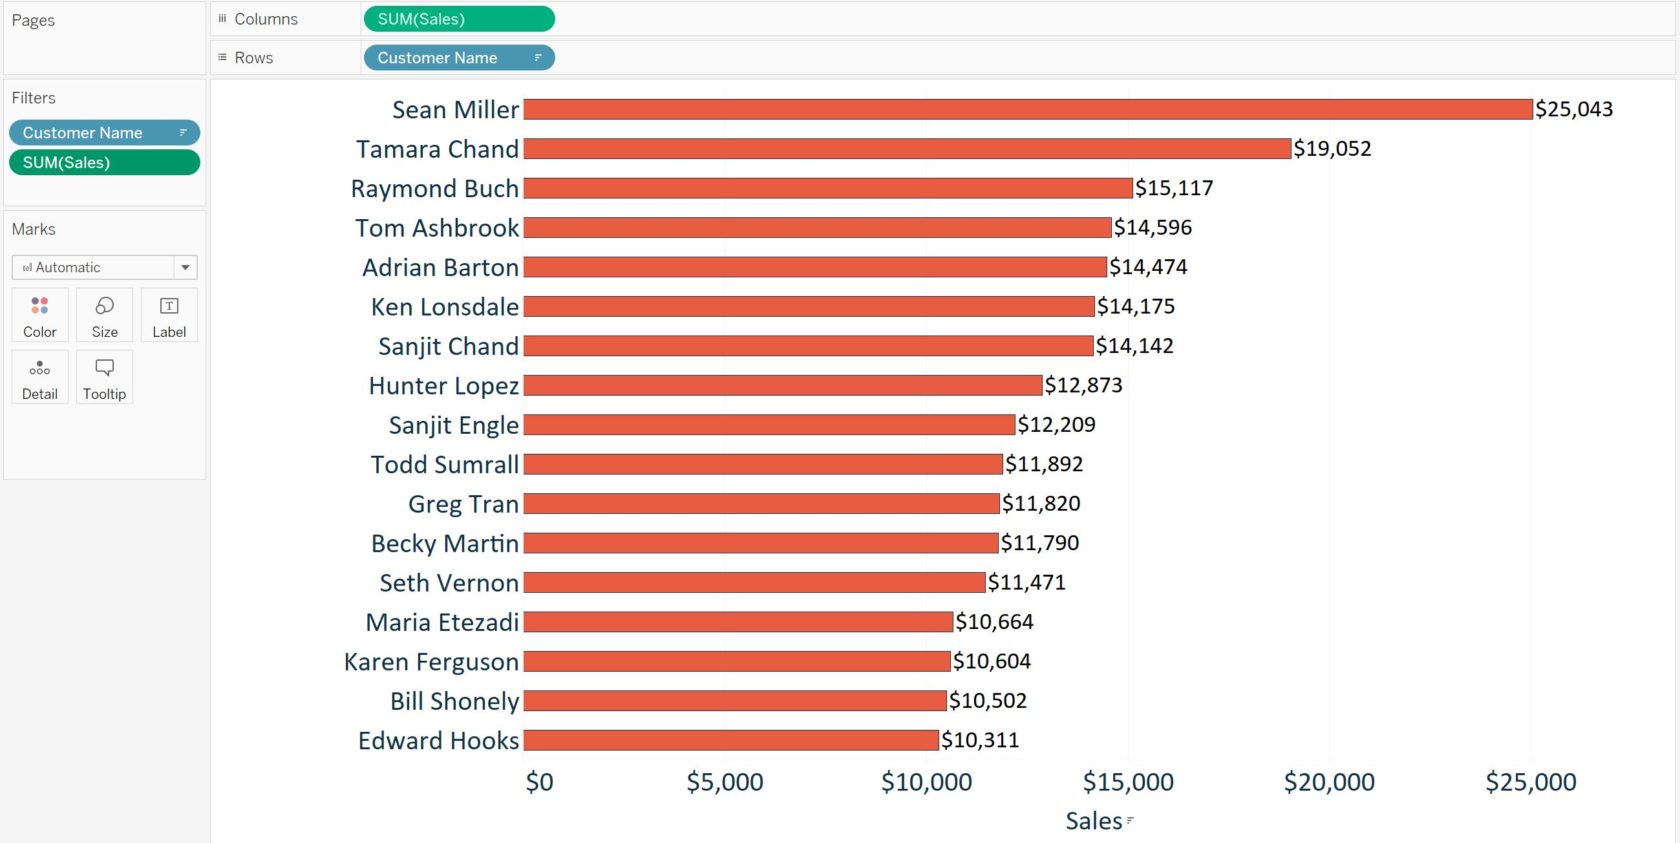
For this post, we will start with the most granular filters, dimension filters and measure filters, and then work our way out to the more ‘macro’ filters. To help illustrate dimension filters and measure filters, we will use this simple bar chart, which is showing the sales per customer from the Sample – Superstore data set in descending order.
The first, and most basic way to filter out marks on a view, is to select the marks, and then choose to keep or exclude them. Let’s say that our boss has an extreme aversion to names that start with the letter “C”, so we want to make sure we remove those customers from the report. To do so, you can go through the list of customers, and use multi-select (Ctrl + Click on a PC) to highlight them. After selecting the names that you want to filter, hover over one of the dimension members (in this case, customer names), and click “Exclude”.
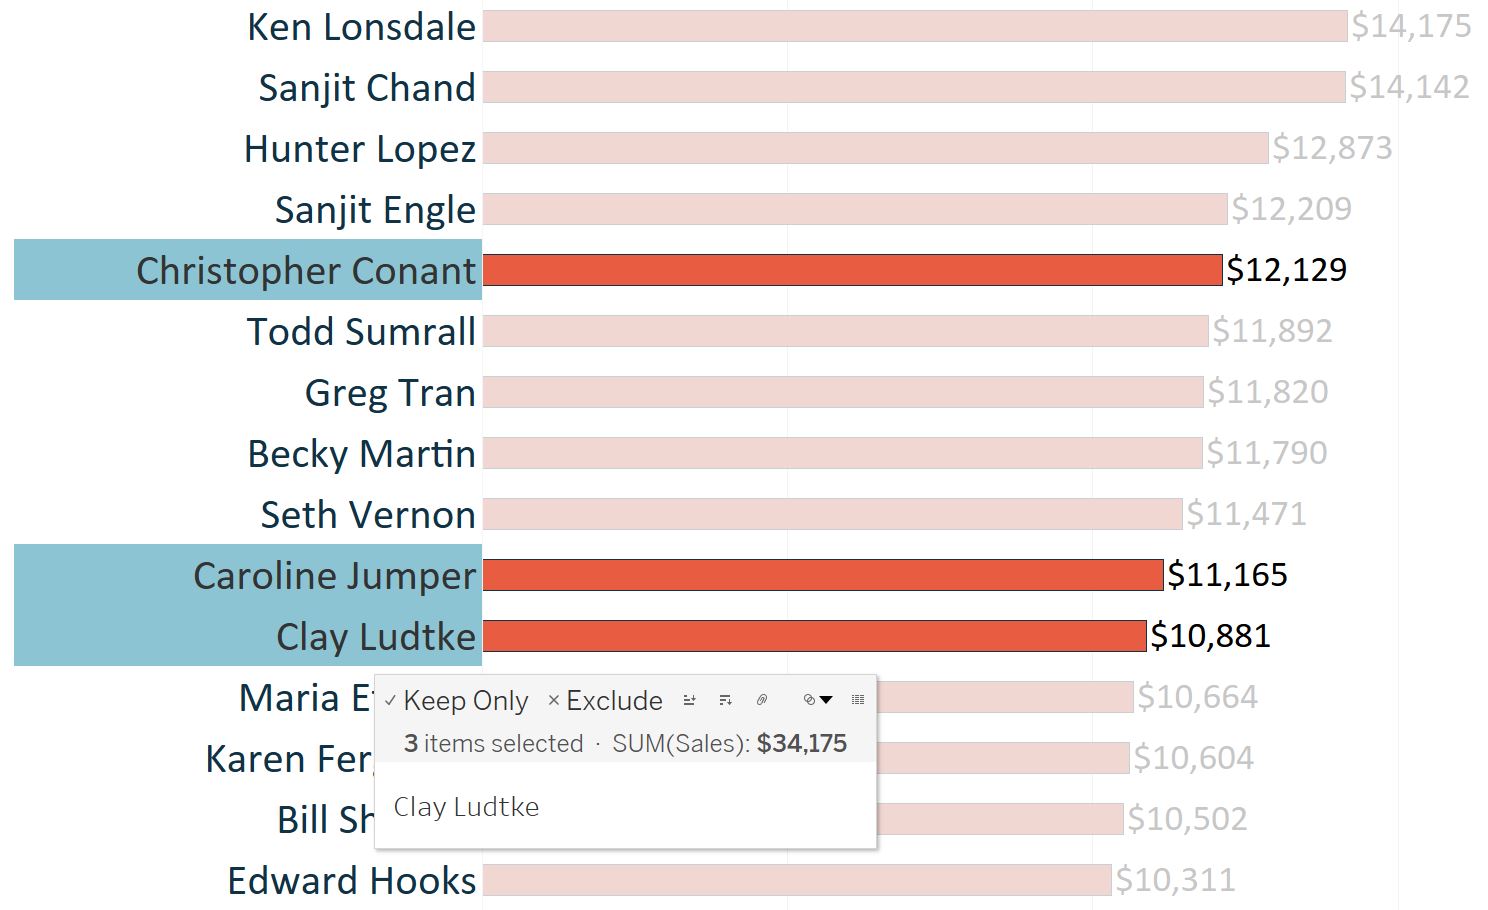
Note that there is also an option to “Keep Only”, which would do exactly what it sounds like, and keep only the selected names on the view.
After choosing “Exclude”, notice that the Customer Name dimension is added to the Filters Shelf in the top left corner of the view.
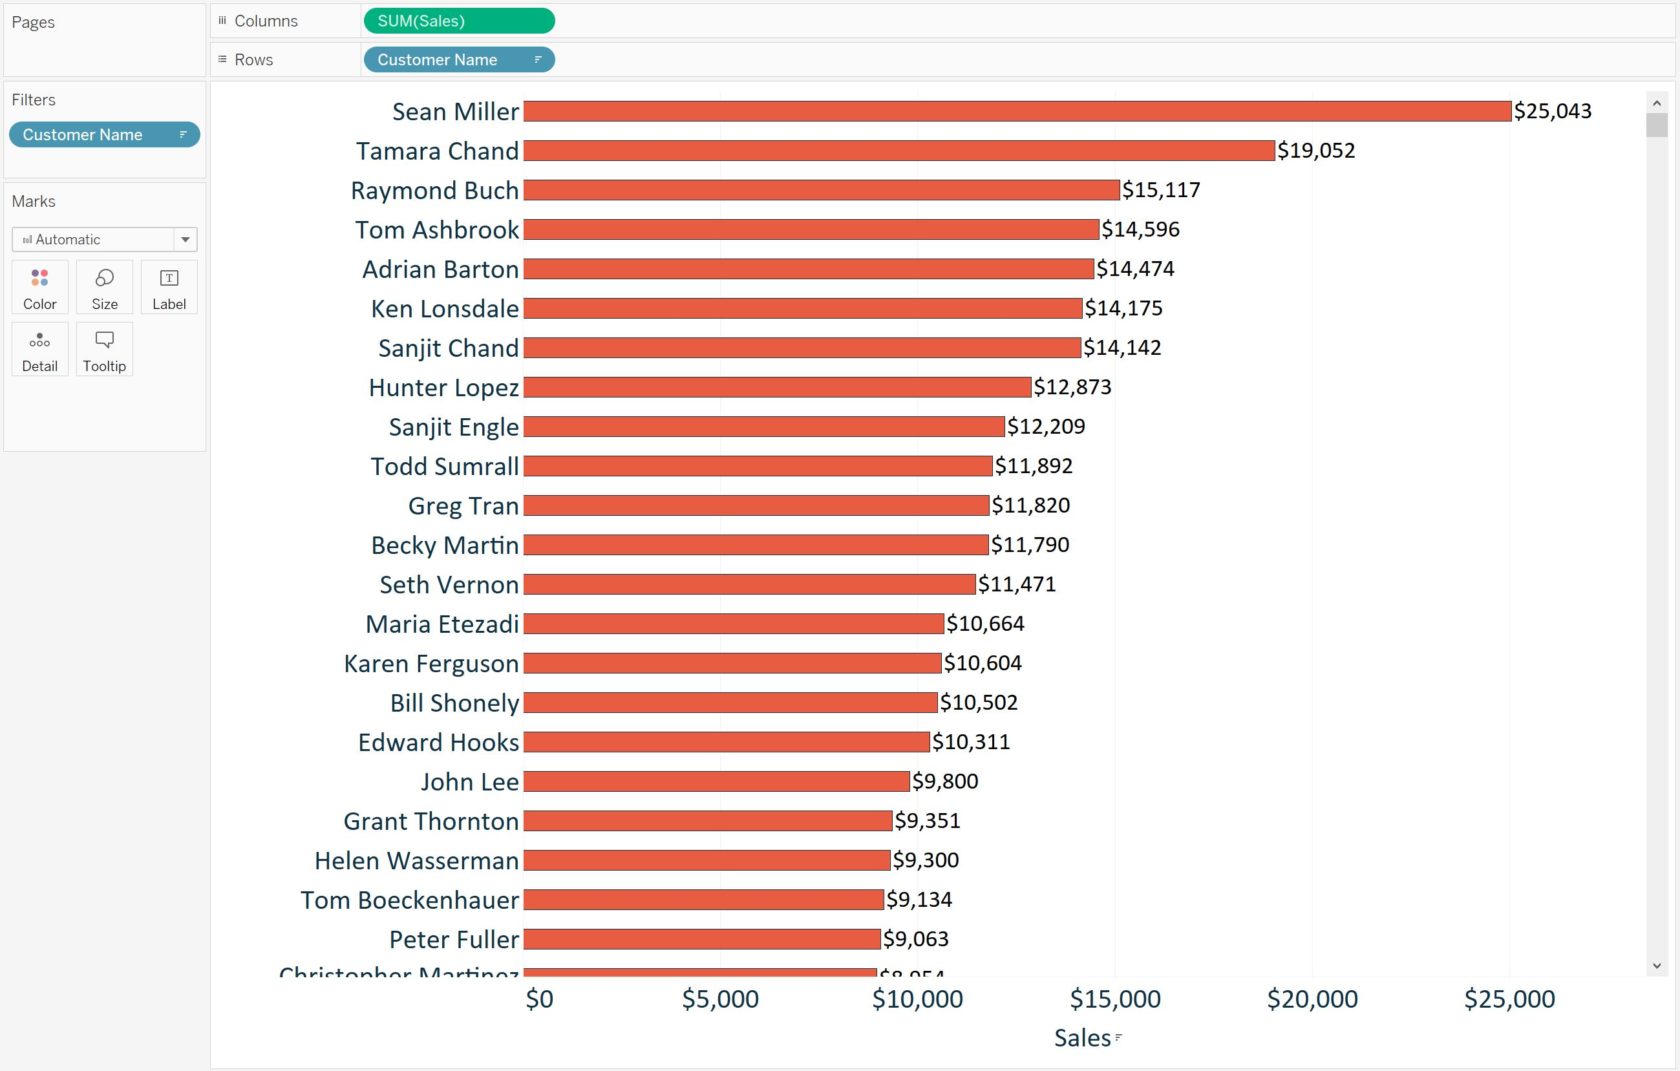
That’s because Tableau created a dimension filter for you when you excluded the customer name dimension members from the view. You could have got to this same point by dragging the Customer Name dimension from the Dimensions Shelf to the Filters Shelf and manually setting up the dimension filter. Let’s take a look under the hood at the options for manually setting up a dimension filter by right-clicking on the Customer Name filter and choosing “Edit Filter…”.
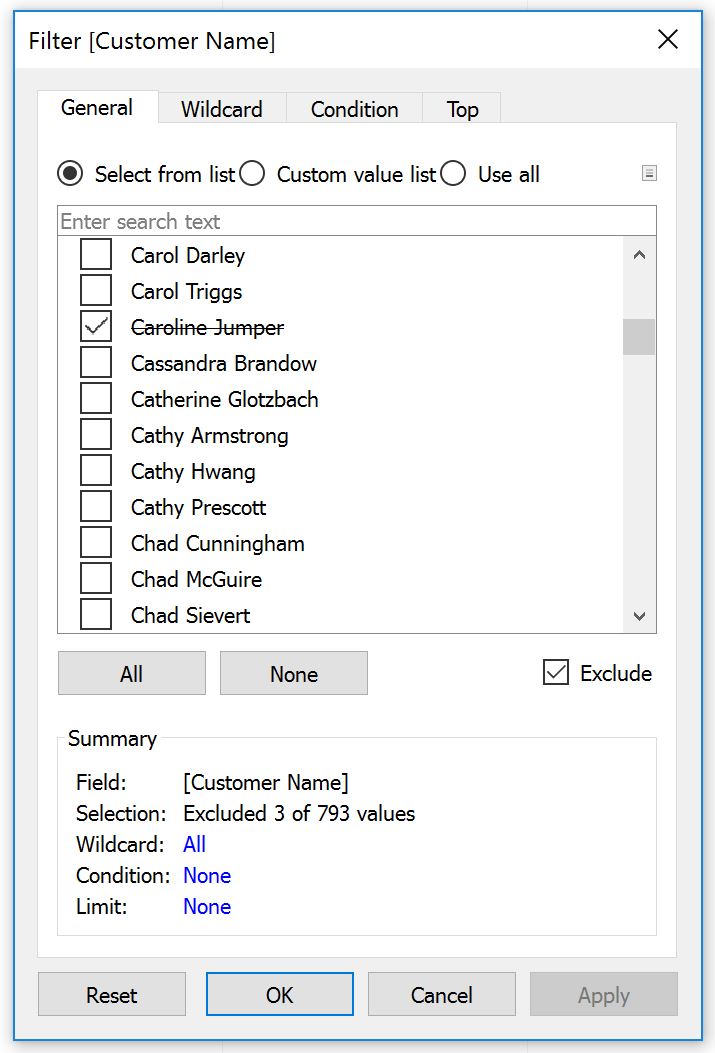
Notice that Tableau created an “Exclude” dimension filter for us when we chose to exclude the three names that start with the letter “C” from the view, as indicated by the box for “Exclude” being checked. There is a summary box at the bottom of the filter that is telling us the criteria for our filter. We currently are excluding 3 of 793 total marks, or customer names, from the view. This manual selection of individual dimension members is the most precise form of filtering, but can also be quite tedious. This is especially true when filtering on the Customer Name dimension, which has 793 individual dimension members.
Fortunately, there are three other tabs at the top of our dimension filter dialog box, which help us refine the filter criteria. Instead of manually selecting all names that start with the letter “C”, we’ll navigate to the ‘Wildcard’ tab and leverage the starts with function.
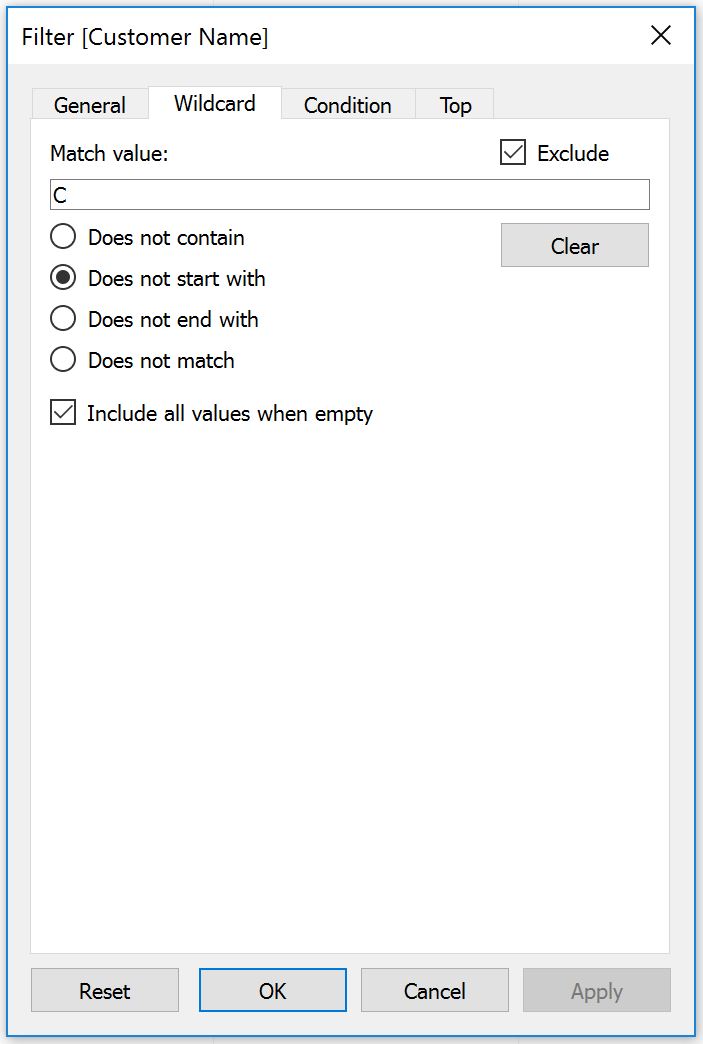
After applying this logic, we are left with 726 of 793 customers – and none whose first names start with “C” so our boss can rest easy! After adding any criteria to one of the four tabs, you can always navigate back to the Summary card on the General tab to see all rules in the filter. Each rule acts as an AND statement, meaning that the dimension members must meet all criteria to be included or excluded from the view.
There are two additional tabs that can be used to add rules to a dimension filter. The Condition tab allows you to add quantitative thresholds that must be met and the Top tab allows you to focus only on the Top or Bottom dimension members based on a measure of your choosing.
Measure Filters in Tableau
Measure filters are similar to dimension filters, but the filtering options are different between the two. To illustrate, drag the Sales measure from the Measures Shelf to the Filters Shelf. The first difference you’ll notice is that before you select the measure filter criteria, you are asked to choose the aggregation of the measure.
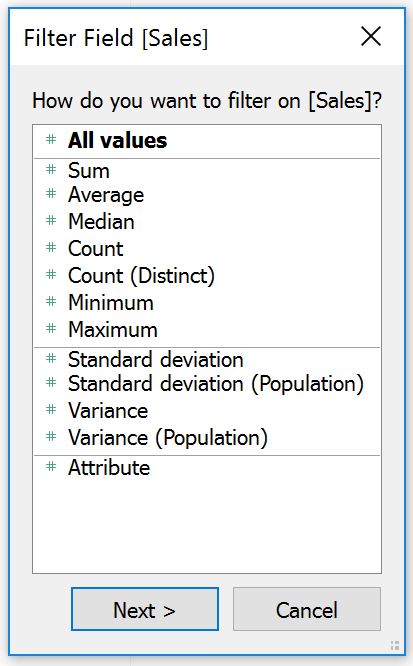
We will choose ‘Sum’ which is the default for most measures. After making the choice of aggregation, you can choose to filter on a range of values, a minimum threshold, or a maximum threshold.
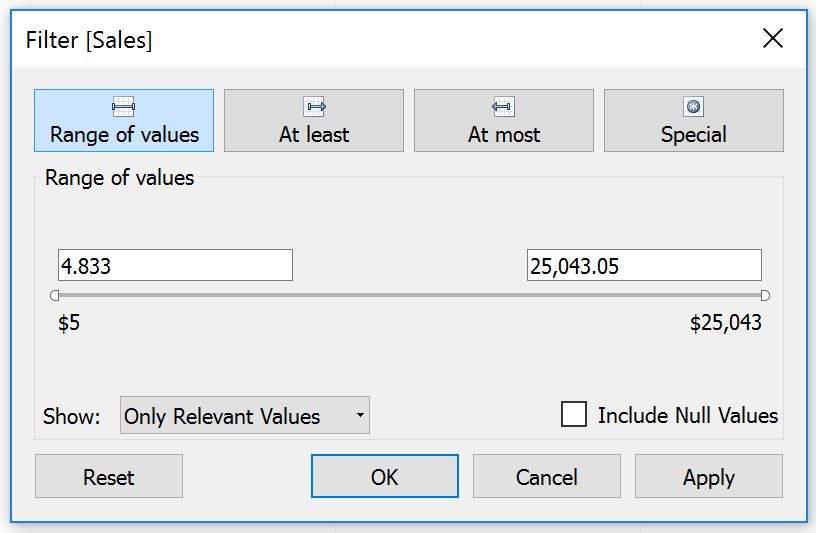
Range of values provides the most flexibility and is the best (and only) choice if you want you and your end users to be able to control both the bottom end and top end of the range. For now, we’ll change just the bottom end of the range to be $10,000. After changing the low end to $10,000 and clicking ‘OK’, the view looks like this:
Note that we now have two filters on the Filters Shelf; one dimension filter and one measure filter. All of the filters that you place here will act as a condition in an AND statement. So at this point, in order for a customer name to be shown on the view, it must not start with the letter ‘C’ and sales must be between $10,000 and $25,043.05.
Note that you can add additional dimension or measure filters, even if the fields are not used to generate the view.
More Options with Filters
Sometimes, you want a filter to be permanent and do not have any interest in changing its criteria. Other times, you would like to change the criteria or even let your end users decide what is filtered on the view. Any filter can be shown to you and your end users for easy manipulation by simply clicking on a filter from the Filters Shelf and choosing “Show Filter”. Upon doing so, you will see the filter appear in the top-right corner of the view. If you’re not happy with the default format of the filter, you can click the down arrow in the top right corner of the filter being shown on the view and change it. Dimension filters have seven different formats to choose from and measure filters have three different formats.
Lastly, dimension and measure filters are applied to only the worksheet you added it to by default. However, filters can be changed to apply to additional individual worksheets, every worksheet that shares the data source, or new with Tableau 10, even all related data sources. This provides the ability to make filters global so that changing their criteria in one place filters the views throughout the workbook. To change the worksheets that a filter is applied to, click the filter on the Filters Shelf, hover over “Apply to Worksheets”, and make your selection.
‘Macro’ Filters
Dimension and measure filters are the most granular form of filtering in Tableau, and will be used most regularly. Occasionally though, you may want to apply a filter at a higher level, such as the data source or extract. This type of ‘macro’ filter provides the benefit of reducing the size of the data set, one of my top five efficiency tips for working with data in Tableau.
To add this type of filter, navigate to the data source editor by either (1) right-clicking on the data source from the Data Window and choosing “Edit Data Source…”, (2) clicking on Data in the top navigation, hovering over the data source of interest and choosing “Edit Data Source…”, or (3) clicking on the Data Source tab at the bottom of the authoring interface. Once there, you will see an option to add filters to the live data source or data extract in the top-right corner. Once you choose a dimension or measure to use as a filter, the filter dialogs will look very familiar to the filters we have introduced to this point. Only now, the filters will be applied to the entire data source before you create individual views.
Written By

Evolytics
This post is curated content from the Evolytics staff, bringing you the most interesting news in data and analysis from around the web. The Evolytics staff has proven experience and expertise in analytics strategy, tagging implementation, data engineering, and data visualization.