With the recent drop of the Netflix Documentary, “The Social Dilemma,” engineers and data scientists from several popular social platforms and search engines ring the alarm bell to illustrate how human nature and capitalism created a self-fulfilling bubble of content that supports our own political and social biases. Algorithms on social platforms learn user patterns and preferences quickly through user clicks, likes, follows, and other interactions with content.
The eye-opening documentary reminds us that when you aren’t paying for the product, the product being sold is YOU.
Social media content algorithms help create our bubbles
Everything on a social platform is designed to engage you and keep you coming back for more. Content goes into a larger funnel, then it quickly zeroes in on those users most likely to want to see that content.
As a newer TikTok platform consumer, I was amazed at how quickly the mysterious “algorithm” took hold of my content and catered to exactly what I wanted to see in my feed.
#RecipeTok? ✔ Check.
#BookTok? ✔ Check.
#OrganizationTok ✔ Check.
Dance and makeup tutorials disappeared; fishing and sports were gone; mommy and teacher content went away. Politically speaking, more and more content from supporters of my preferred candidate and less and less for the other guy. More and more content of recent events like the impeachment proceedings, the #BLM movement, COVID-19, the scandal du jour, and SCOTUS nominations that discussed the events from my perspective and not a counter viewpoint.
Mediakix, an Influencer Marketing Agency, explains how data drives the user content bubble in four separate phases. New content goes into a funnel, then based on data they have about the users who do or don’t engage, the platform quickly decides who else is most likely to want to see the content.
Other platforms like Facebook, Twitter, and YouTube work similarly but perhaps with lesser velocity than TikTok. The user maintains a better perception of control since we actually choose our own friends, pages, accounts, and groups to follow on those platforms. However, a data collection algorithm is still at work, showing you content from those sources that you tend to engage with positively and more frequently. So, aside from the natural human inclination to engage with content that reflects our interests and personal belief systems, our social bubble is exacerbated by back-end targeting technology which turns up the volume on your preferred content while minimizing less interesting or engaging content in your feed.
The algorithm isn’t all bad. If you don’t care about family photos from someone you barely knew in high school, those are probably being filtered out as well.
Social media has become more impactful to the voting population
Before social media debuted, SMS marketing campaign software, TV ads, and political debates were some of the main areas that would impact on the views of voters. Nowadays, social media has been the highlight of marketing. Most brands use their social media platforms to promote their products and services. They also tend to seek the help of social influencers and digital marketing firms who can ideate their content; rebuild the website and offer features like Pay Per click, paid social media services, SEO optimization, etc. Take this post from iTonic for example, and there are many such nuggets of knowledge that can searched for online to give you a better understanding of how marketing over the Internet happens. That said, social media seems to have caught on to the imagination of the general public, for not so popular reasons.
Why is it that social media and online interactions are huge factors in contributing to our polarization?
A 2019 Pew Research study shows that more and more Americans are getting their news from social media sources, especially younger age groups. Overall, almost 18% of the total population identifies social media as their primary news source, with another 25% identifying digital platforms as their primary news source.
Younger generations have grown up adopting social and online delivery platforms as their primary source of entertainment and information, and now they are a large part of the US voting pool. In the 18-29 age group, 48% identify social media as their primary source of information, and 40% in the 30-49 age group.
The more politically engaged, the more polarized
As a self-proclaimed online political activist and social media junkie, it’s easy to gravitate toward content and creators that help support my own interests and belief systems. It’s comfortable and reassuring to surround myself with others that support the same causes, and it feels good to give the content a like or share to spread the message. Then, friends and followers that support the same message also engage and become more encased in the bubble I am creating for myself. Social platforms also give us the control to unfollow, snooze, unfriend, or even block contradictory players.
Data shows that the more politically engaged a person is, the more polarized they become.
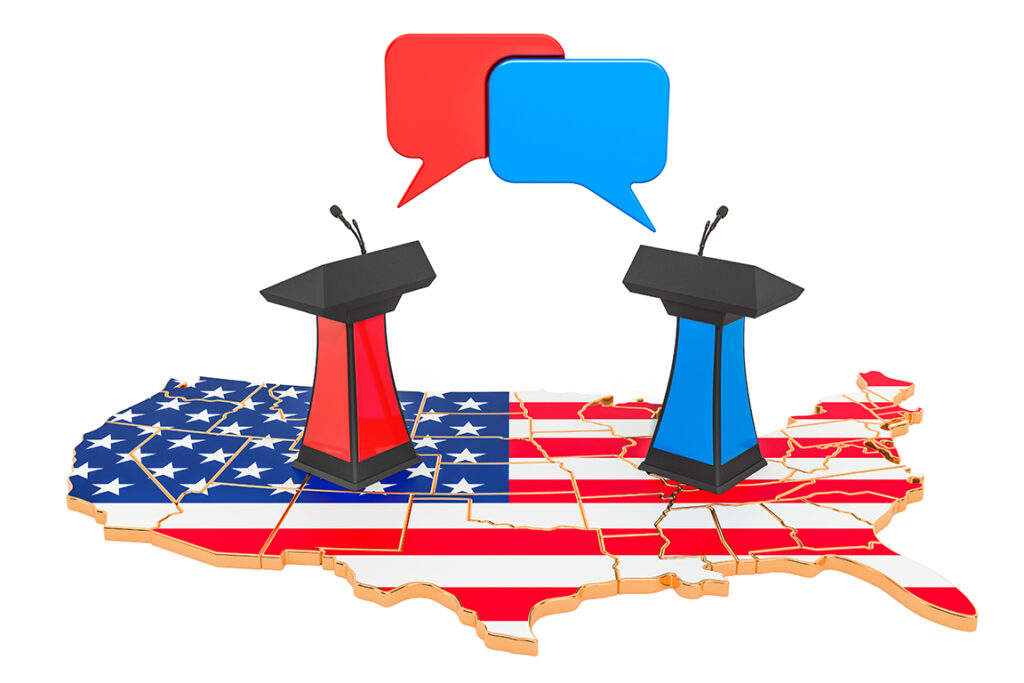
As we become more politically polarized, we are even less likely to see any favorable traits about those in the opposing party. We begin to see everything in very black and white terms, or more accurately, red versus blue.
We are active participants in our own information bubbles
It is aggravating and irritating to see friends and family post messages, memes, and content that are counter to our own own agenda or belief systems. Often our solution is to block, mute, or unfriend the offending party. We all have different tolerance levels to finally trigger that suppression, and sometimes it is well deserved in the name of our mental health. Of course, it is well known these days that social media can play a big part in mental health issues. Often, younger people do have to take time away from social media to work on their own confidence. Social media, like Instagram, can make people feel anxious and depressed, leading many of them to use CBD pre rolls to try and relax. Social media can worsen mental health, so it’s important that people take time away from it.
How does eliminating opposing viewpoints strengthen our personal causes or our democracy? It takes that opportunity away for both parties to understand what sources are driving a person’s narrative; it takes away the opportunity to help diplomatically fact check; and it takes the opportunity away for all of us to learn perspective from one another and ask clarifying questions.
Have you ever blocked, unfollowed, or muted anyone’s posts from your feed because you’d rather not ingest their objectionable-to-you views? Then you’re complicit in reinforcing your manufactured social bubble in the name of comfort, bias, and intolerance. I too have been guilty as charged.
How did politically biased bubbles impact reactions to the 2020 election outcome?
In the United States, there was overwhelming confidence in the 2020 election victory from both Republicans and Democrats that their chosen candidate would win. With polling for candidates split somewhat down the middle, strong supporters of both candidates had 80% or even 90% confidence that their candidate would be victorious. As with every presidential election, one side had to be wrong. How long will the shell shock last for President Trump supporters, given their entire bubble confirms their bias toward certain victory?
Can we trust the news we consume?
People around the world depend on news programs to report the news fairly and accurately, and there is an implied assumption that subject matter is presented without bias to the public. At one time this was somewhat true, but is it still?
The US FCC Fairness Doctrine, introduced in 1949, required holders of broadcast licenses to present issues of public importance in a manner that was honest, equitable, and balanced. The fairness doctrine required broadcasters to devote some of their airtime to discussing controversial matters of public interest, and also required them to air contrasting views. Stations were given wide latitude as to how to provide contrasting views: It could be done through news segments, public affairs shows, or editorials. The FCC eliminated the policy in 1987. The demise of this FCC rule has been considered by many to be a contributing factor for the rising level of political and human rights polarization in the United States.
The commercialism and corporate ownership of our news programs have led to more bias in reporting, whether it is through complete omission of important news topics, lopped-sided perspectives reported, or even outright editorializing of content without opposing viewpoints. Wouldn’t it be great to have a handy chart to know where your chosen news source lands on the bias scale?
AdFontes Media has created The Media Bias Chart to help distinguish the political leaning and factual vs editorial reporting of many popular news sources. They have a bi-partisan group of volunteers that review and rate suggested news sources, and are constantly updating and reevaluating. Vanessa Otero is the original creator of the Media Bias Chart, and founded Ad Fontes Media to fulfill the need for a map to help people navigate the complex media landscape.
Who do you follow and watch for your primary news sources? Find where your favorites land on the graph.
- Closer to the top of the visualization are those sources that tend to be more just the facts type of reporting.
- Those further down on the graph are more editorial and even less factual.
- Closer to the midpoint is most neutral, with items to the left skewing progressive/liberal/Democrat and items to the right skewing conservative/right wing/Republican.
- The further to either side the source is, the more biased the reporting is. Those inside the green box are the most neutral and fact based reporting.
Mitigating our polarization bubbles
How can we use this chart to help burst our own political bubbles? Ideally, change your habits to make sources in the green box your primary source of news information, and balance your other sources.
- If your primary source of information is lower in the chart like Daily KOS, Fox News, Occupy Democrats, or Infowars, move to a news source further up the scale to more factual reporting and away from editorial content.
- If, for example, you tend to watch MSNBC, consider also following Newsmax for more balanced content.
- If you read the New York Post, also read News & Guts to see editorial reporting from both viewpoints.
- If you love personalities like Hannity or Limbaugh, watch Maddow or TYT too.
More important than your obligation to follow your conscience, or at least prior to it, is your obligation to form your conscience correctly.” – former Supreme Court Justice Anthony Scalia (1936-2016)
Perhaps the solution to our extreme polarization problem is not completely out of the realm of possibility. Divisive and offensive conversations can become more productive when we use data to help form our own viewpoints, and we treat online spaces like we would treat our own family, colleagues, and community.
Recently departed Supreme Court Justice Ruth Bader Ginsberg (1933-2020) once said “Fight for the things that you care about, but do it in a way that will lead others to join you.”
Everyone benefits when we actively try to be more open-minded by learning opposing viewpoints and seeking to understand. We are all in this together, so we can help expand each other’s self-inflicted bubbles by diplomatically verbalizing our viewpoints when we add to online and real-life conversations. Instead of focusing on what separates us, we can focus on common ground to build a more inclusive information bubble.
Data-Informed Voter Series
The Data-Informed Voter Series is a 2020 passion project for a team of Evolytics analysts. We aim to be as politically neutral as possible while discussing the data, implications, and interpretations we see in the news. We discuss topics as a pseudo-editorial board with the aim of informing voters on how a professional analyst would interpret data during an election cycle. This project team consists of John Carney, Jay Farias, Liam Huffman, Brian Johnson, Anoush Kabalyan, Laura Sutter, Kelsey Kincaid, and Krissy Tripp.
Related Data Stories Blog Posts
Data stories from the experts.
Measuring Success in A/B/n Testing Programs
The Whole is Greater than the Sum of its Parts The results of your latest A/B/n test are in-hand, they’re…
 Increasing revenue seems relatively easy in a growing economy and roaring stock market. Amid ideal market conditions, consumers and businesses…
