Blog


Sharing analytics tips, expert advice and industry insights.

Tableau 201: How to Make a Stoplight 100-Point Index

As an analysts, the ‘Stoplight’ 100-point index is a reporting mechanism that we cannot live without. If you are not familiar, the 100-point index is a simple way to know whether a measure is outperforming …

Tableau 201: How to Make a Highlight Table

In our data-driven storytelling tips series, we demonstrate an exercise for “Smoothing the Excel Transition” by introducing the value of data visualization. In the example, we simply encode the values in a large text table …

Tableau Hack: How to Highlight a Dimension

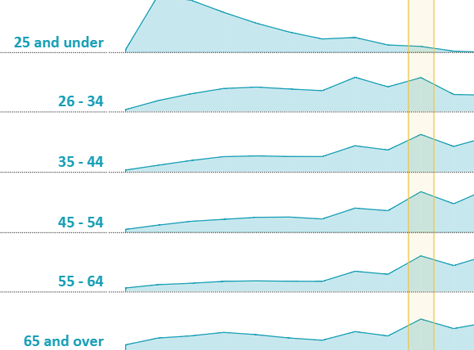
In our viz, U.S. Income by Age and Marital Status (pictured right), we wanted our end users to be able to choose their personal combination of age, marital status, and income – then have the …

Tableau 201: How to Make a Dual-Axis Combo Chart

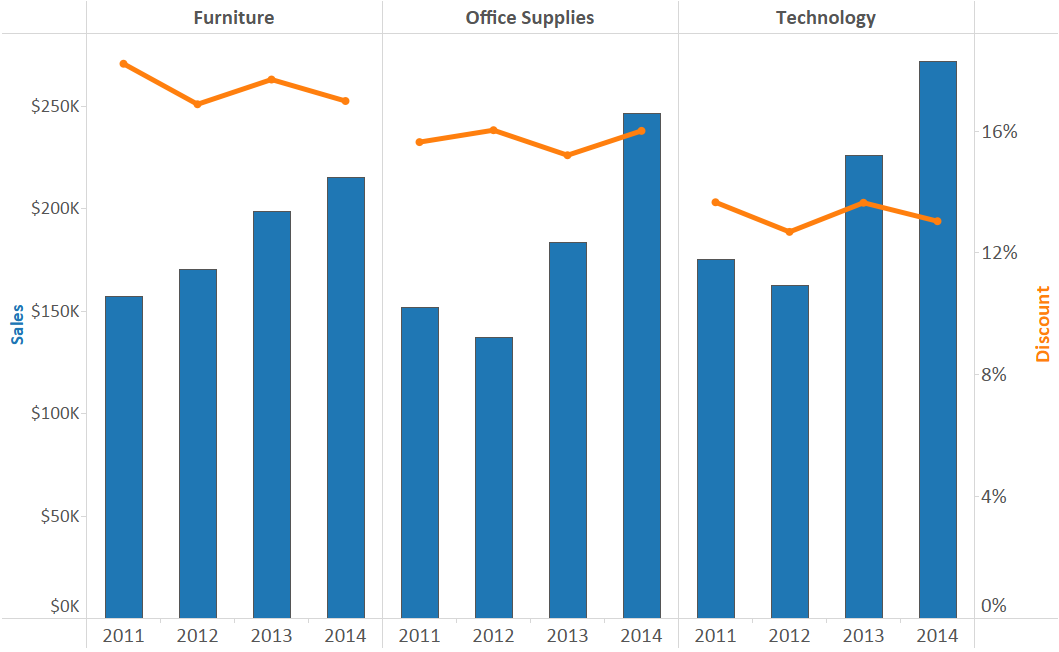
Dual-axis combination charts, or Combo Charts, are an effective chart type for showing related information while saving real estate by combining views. This chart type is created with one shared axis, such as an X-axis …

How to Learn Tableau: My Top Five Tips

When it comes to data, there are a lot of different solutions available to help businesses process it better. From Tableau to Marketo to Microsoft Dynamics — there’s even Vertify to integrate the last two! …

Evolytics’ Ryan Sleeper Earns Tableau Public Viz of the Year

Evolytics’ Director of Data Visualization, Ryan Sleeper, has been selected as the winner of Tableau Public’s Visualization of the Year for his viz, The Cost of Attending the 2015 World Series. Each year since 2013, employees …

Tableau 201: 3 Creative Ways to Use Dashboard Actions

Dashboard actions, filters, and parameters are three of the best tactics to use in Tableau because they provide a way to transfer control of the analysis from you to your end users. This is critical …

Tableau 201: How to Compare Two Date Ranges on One Axis

In the post 10 Data Viz Tips I Learned from Google Analytics, I shared that before I started using Tableau, I began my career in digital analytics using Google Analytics. One of the features I …

Data Viz Exploration: The Force Amasses (Tickets)

1/13/16 UPDATE: Since its release on December 18th, The Force Awakens has moved into 15th place in all time domestic tickets sold. This makes it the third most successful Star Wars film to date, behind 1980’s …

Tableau 201: Allow Users to Choose Measures and Dimensions

We’ve often discussed how powerful parameters are in Tableau because outside of filters and dashboard actions, they’re one of the only methods for putting control into the hands of your end users. In previous tutorials, …