One of the most powerful features of Tableau is the “Level of Detail” (LOD) functionality, which provides a syntax for explicitly assigning a different level of detail, or granularity, to a measure.
This unlocks many valuable analysis opportunities, with just a few outlined in Tableau’s post, Top 15 LOD Expressions.
We admit that we have probably leaned on this functionality too much since its release because it is such a handy way to get the exact results we are looking for.
This post shares one of our favorite uses for LOD expressions: the ability to create a constant measure that can be used as a benchmark.
For example, sometimes you want to compare the performance of a KPI now vs. a KPI last year.
Another example is in split testing, where it is common to need to compare the performance of a variant recipe to the performance of a control recipe.
In the past, table calculations were the easiest way to create these comparisons, but the simple LOD calculation we are about to share makes the analysis slightly more foolproof because you do not need to worry about the scope or direction of a table calculation.
This post shares a specific use case for using LOD expressions, but is not a comprehensive training on what LOD expressions are and how they work.
If you need more information, we encourage you to read the Tableau whitepaper, Understanding Level of Detail (LOD) Expressions.
Why Fixed Comparisons are Valuable
There are several analyses where a fixed comparison measure would be valuable.
To name just a few, the performance during a specific year, a goal, a competitor, or the performance of a control recipe.
For the purposes of this illustration, we are going to use the Sample – Superstore data in Tableau to compare the sales each year to the sales in the year 2012.
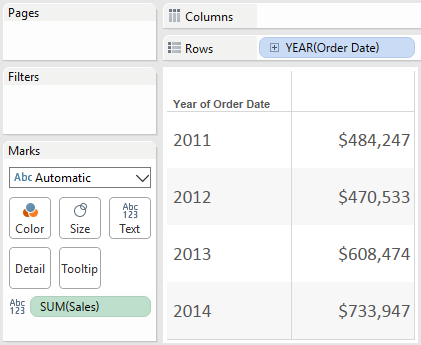
Here’s a simple table showing sum of sales by year:
As you can see, we have four years of sales data.
Let’s pretend that because 2012 was the lowest year in our company’s history, management wants to use 2012 as a benchmark for the lowest acceptable sales number.
So we will create a comparison metric that isolates the sales in 2012.
We realize this isn’t the best example of a true business scenario – but work with us momentarily – we are showing how you can isolate a comparison metric, even if it’s not in the first row, and even without using table calculations.
Isolate the Benchmark
In order to isolate 2012 sales, your first instinct may be to create a calculated field that looks like this:
SUM(IF YEAR([Order Date]) = 2012 THEN SALES END)
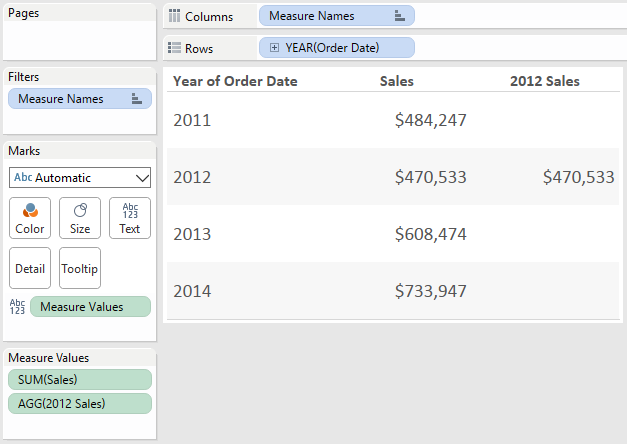
We are going to go ahead and make a calculated field with this formula and add it as a second column in the view:
Our calculated field worked, but you can see that only the row for 2012 is populated with the 2012 sales amount.
That’s because Tableau is looking at each row and running our IF / THEN logic. It looks at the first row which is for 2011, sees that YEAR([Order Date]) does not equal 2012, so it does not display the sales amount.
The same is true for 2013 and 2014, so there are nulls in the cells for every year other than 2012 for 2012 sales.
This doesn’t provide any value for our analysis because we can’t, for example, divide 2011’s sales amount by 2012’s sales amount. In order to create that type of growth calculation, 2011 sales and 2012 sales would need to be on the same row.
Adding the LOD
This is where a LOD expression is handy in creating a fixed comparison measure for 2012 sales.
There are three types of LOD expressions: EXCLUDE, INCLUDE, and FIXED.
To create our benchmark for 2012 Sales, we are going to leverage the EXCLUDE expression, which basically means Tableau is going to ignore whichever dimension we put in the expression.
Our calculated field using LOD expressions for 2012 sales is:
{EXCLUDE [Order Date]: SUM(IF YEAR([Order Date]) = 2012 THEN Sales END)}
This calculation says, “Regardless of the Order Date dimension, which is currently being used to display one year per row, always show the sum of sales from 2012.”
Note that because we are wanting to ignore the date dimension in this specific example, Order Date is the dimension following the EXCLUDE function.
If you are creating a benchmark for something else such as a product category, manager, or test recipe, substitute Order Date with the appropriate dimension for your use case.
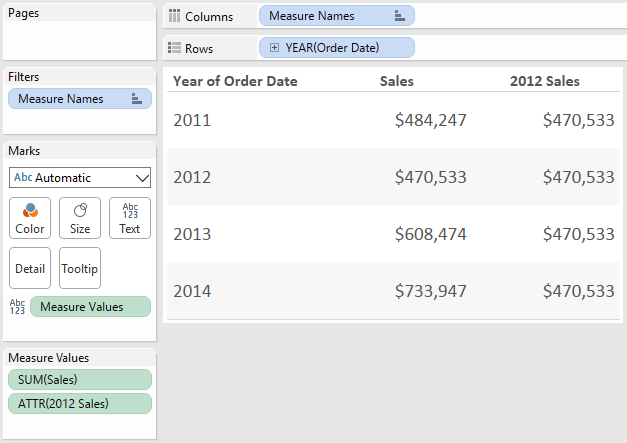
Now our table looks like this:
Now every year displays the 2012 sales amount in the 2012 sales column.
Now that the sales for each respective year and the sales for 2012 are on the same row, they can be used for calculations, such as percent growth.
Adding the Percent Difference
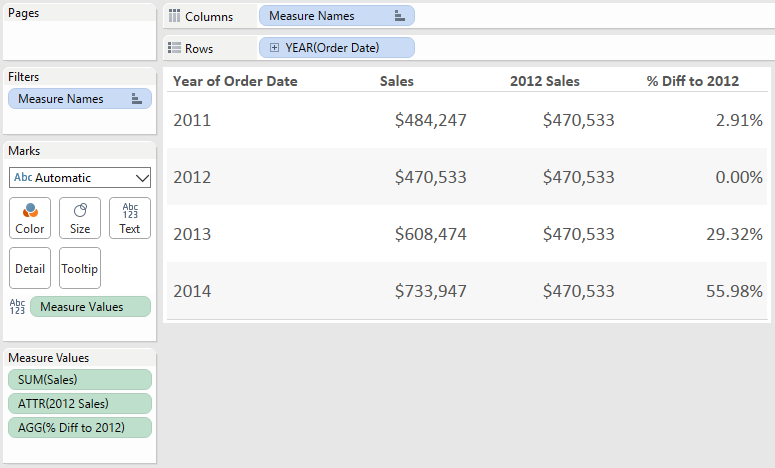
As just one example, we will create a calculated field to show percent difference from 2012 sales and place it on the view as a third column.
The formula is:
SUM(Sales) / SUM(2012 Sales)-1
Here’s the final view:
The percent difference from 2012 sales is just one example, but now that this benchmark measure is available, it can be used in a variety of calculated fields.
We have used it to calculate t-statistics in test results and to create more reliable 100-point index scores in Tableau.
You can even create a parameter to dynamically change the benchmark measure.
For example, in our formula for 2012 Sales above, we could replace “2012” with a float parameter that allows you to toggle between any of the four years on the view.
This would allow the end user to change the benchmark metric on the fly.
We have found this approach to be a simple alternative to table calculations that provides a more consistent, user-friendly, and foolproof result.


