As companies collect larger volumes of data, and in increasing levels of complexity, it becomes more challenging to extract “so what” insights that guide better business decisions—especially if your data lives in disconnected silos. Fortunately, the right data visualization capabilities tie siloed data together into real-time dashboards that identify patterns, trends, and opportunities with quick read visuals to provide value for stakeholders at all levels.
At Evolytics, our Data Viz experts use a variety of the best data visualization and analysis tools to lay out our client’s data in a way that is easy to understand and share with stakeholders. We know that every organization collects different data points with the intent of solving unique business challenges. That’s why our team takes an individualized approach to determine which data viz tools will provide the greatest value to a client.
Here are some of the data viz solutions we use to help clients tell the most illuminating stories with their data, and the benefits of each:
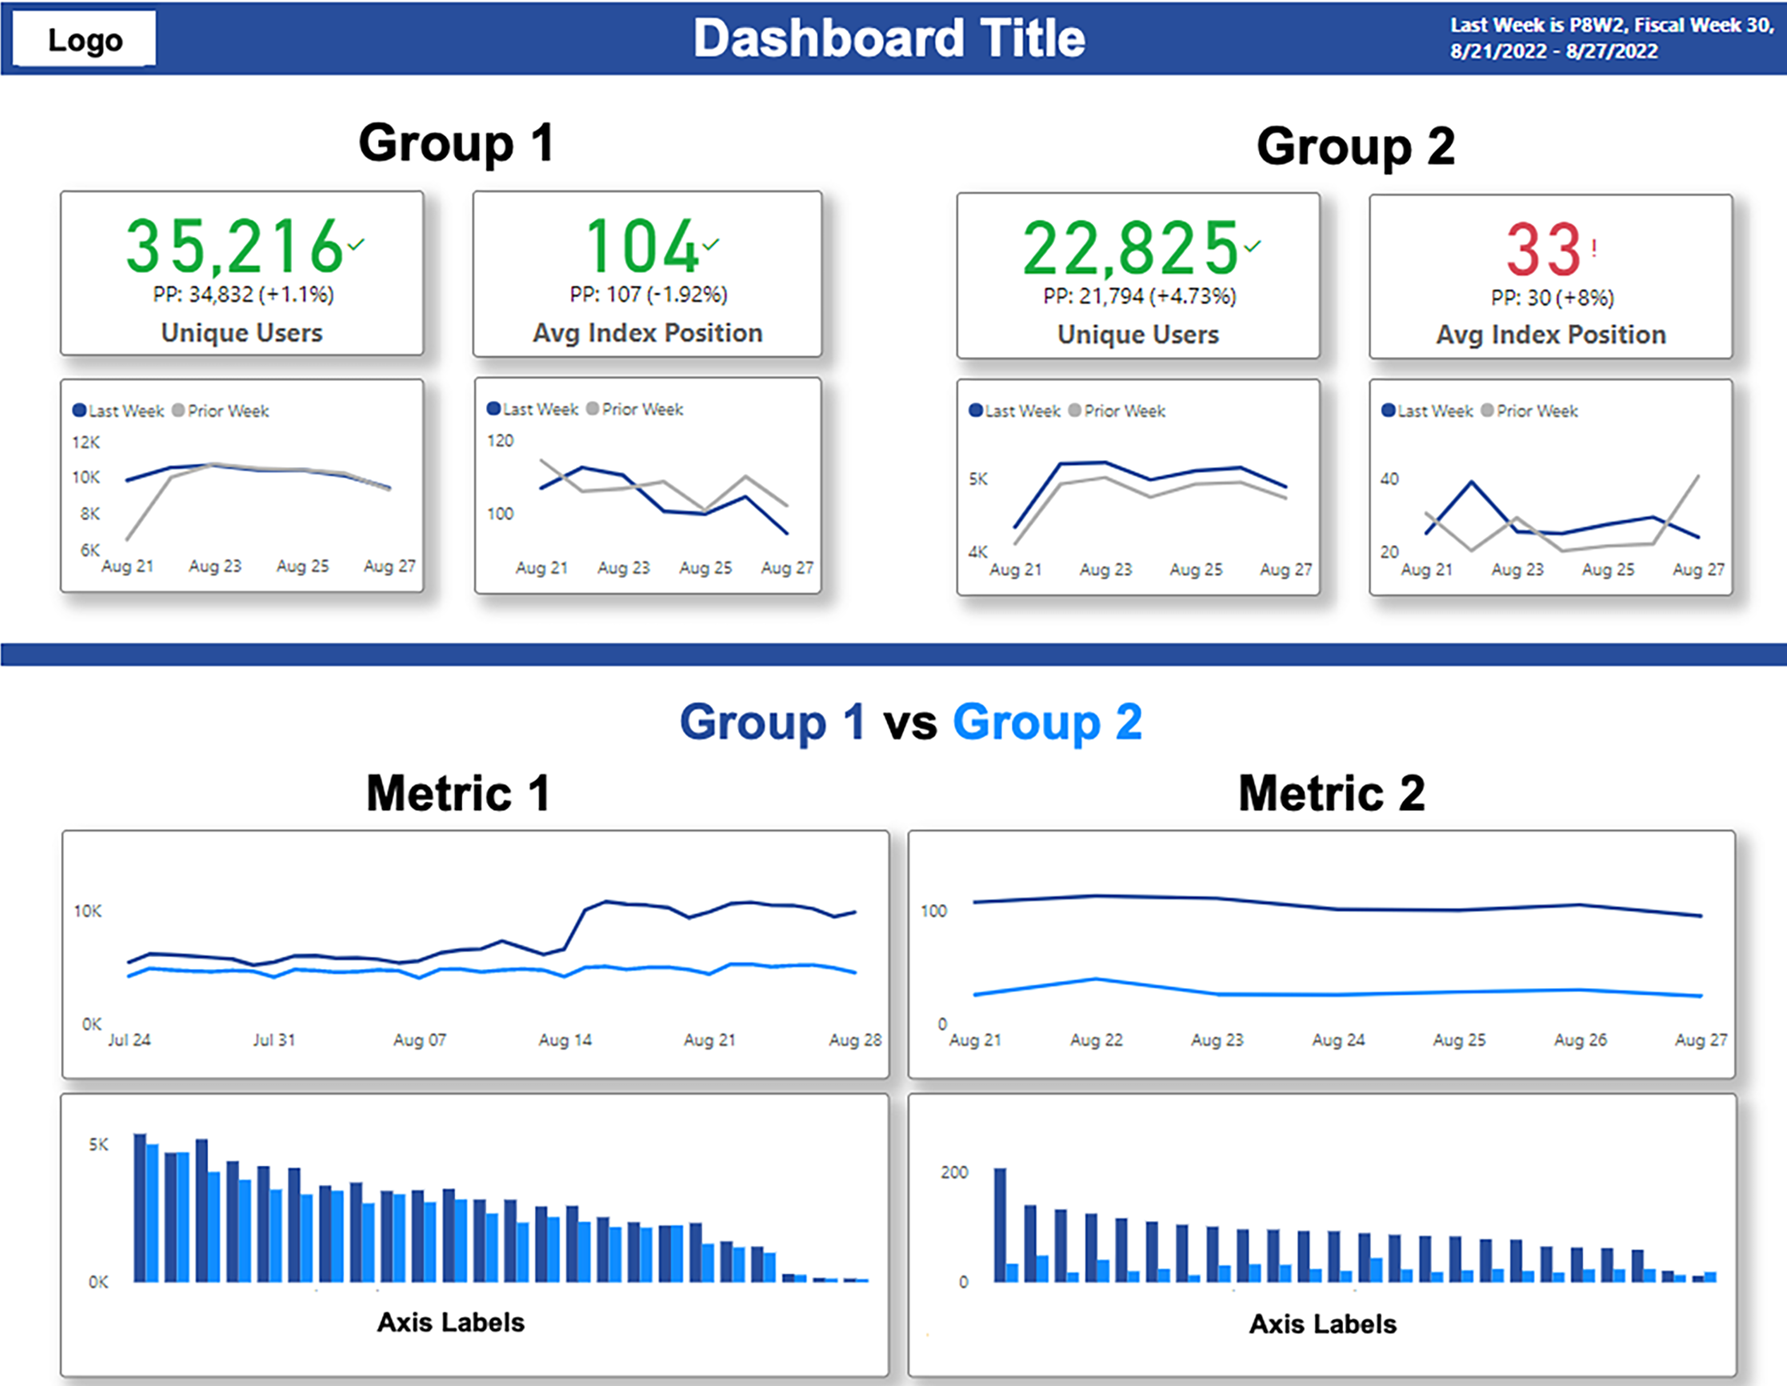
Power BI
- Ease of use, pre-built visualizations
- Power Query allows non-technical users to shape and transform data easily
- Artificial Intelligence capabilities (image & text recognition)
- Inexpensive individual user options
- Streamlined integration with Microsoft products
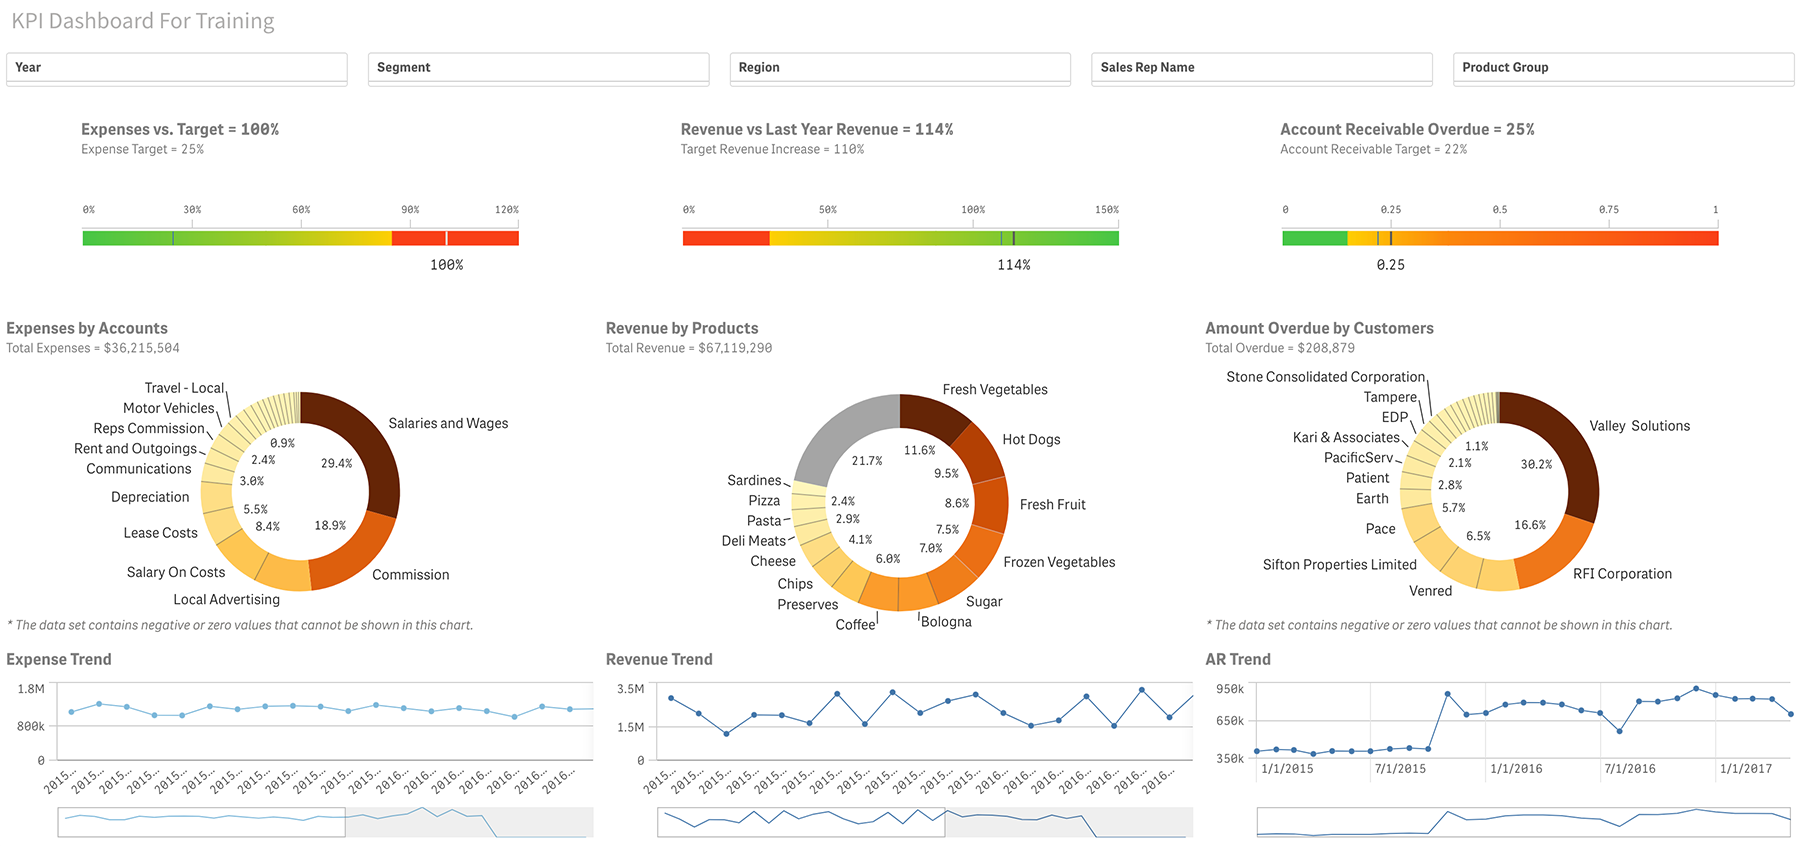
Qlik
- Ability to either drag and drop data files or use ETL scripting for more complex datasets
- Capable of quickly loading large amounts of data
- Includes drag and drop pre-built visualizations
- Extensions allow third-party visualizations and other presentation objects
- Users can interact with charts and visualizations and extract data directly
- Reports are shareable between users, directly in the program
Tableau
- Users easily create visualizations exactly as desired
- Capable of ingesting large amounts of data
- Performs basic data science and forecasting functions
- Options to extract data or work with live data
- Connects to nearly any data source or API

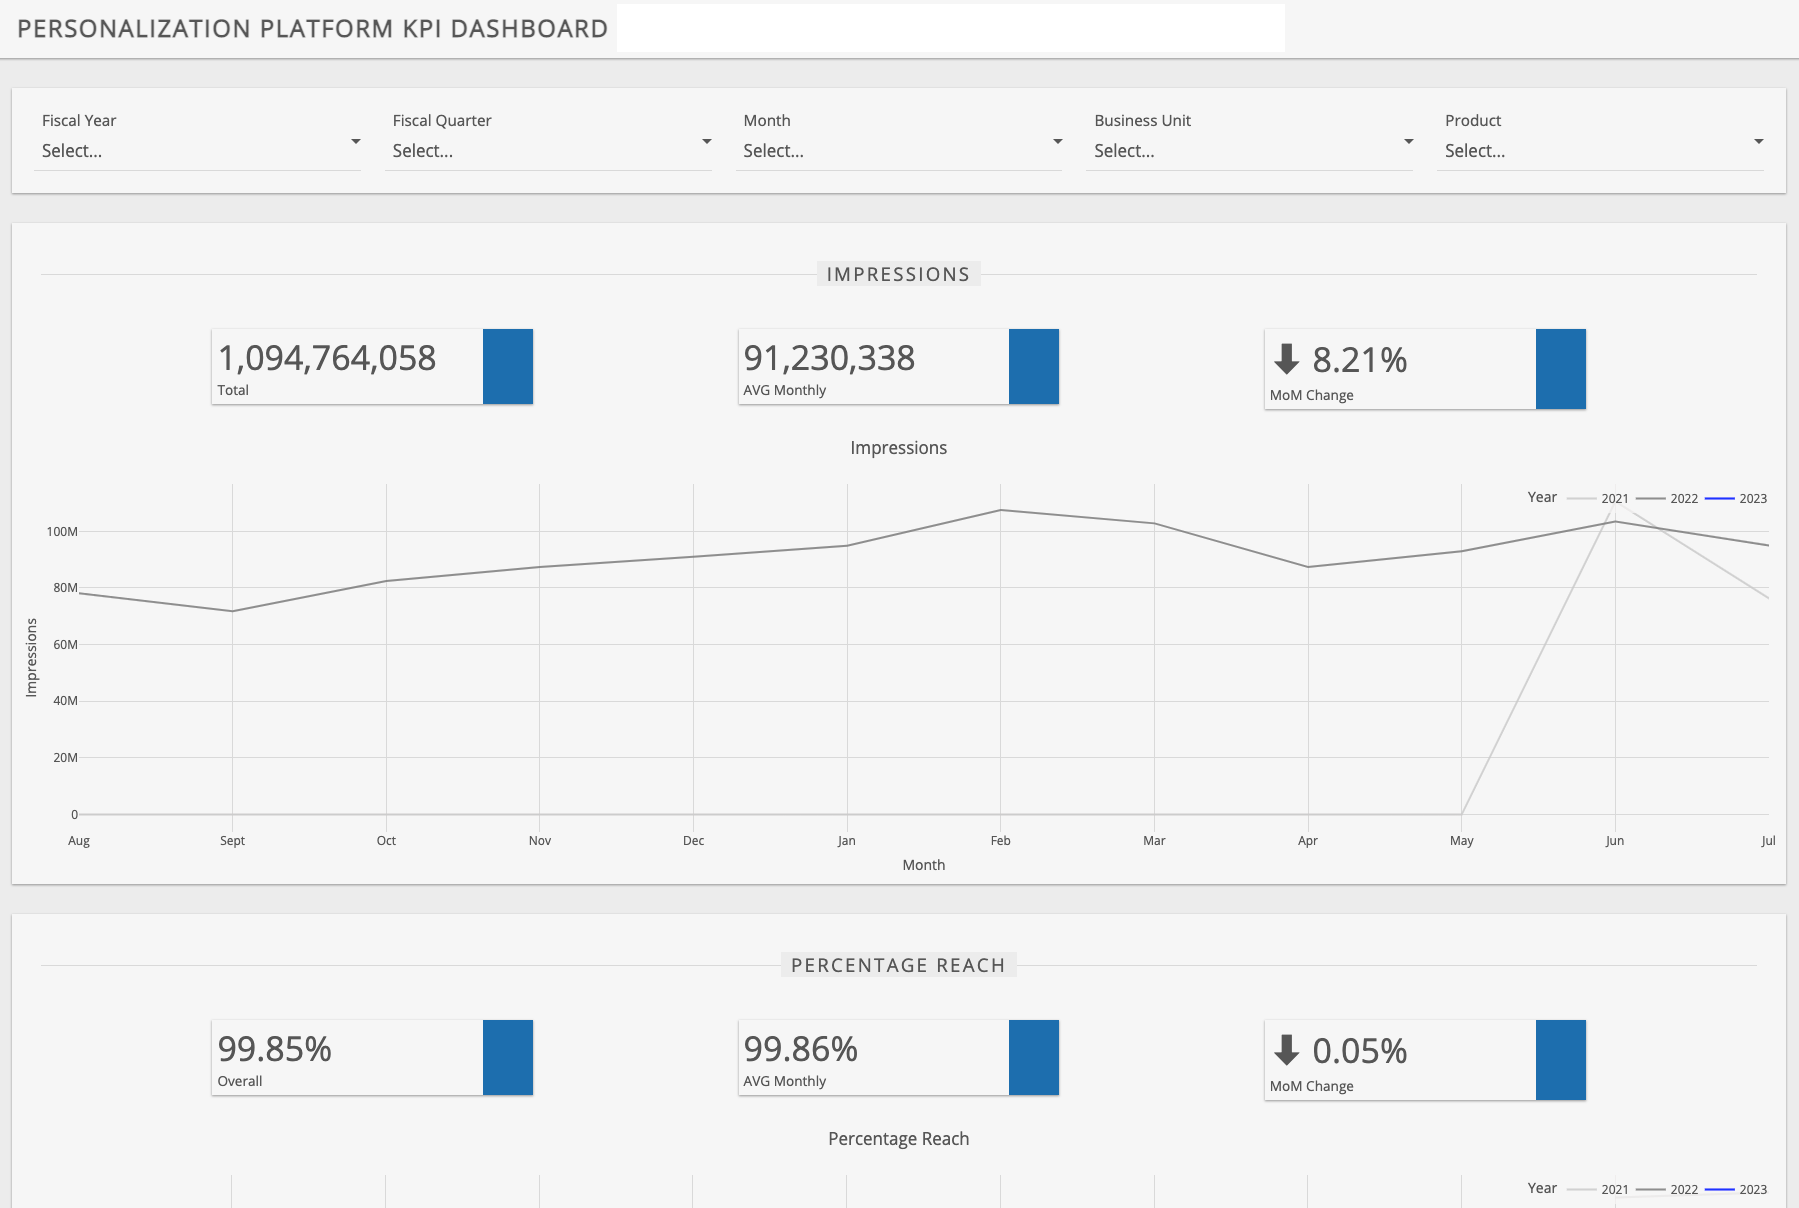
QuickSight
- Easy-to-use, pre-built visualizations
- Fits directly into AWS environment
- SPICE provides rapid data ingestion
- Quick and responsive dashboards for easier analysis
- Inexpensive enterprise options

Dash Enterprise (Dash Plotly)
- A blend of Python + HTML logic
- Enhanced data science capabilities
- Ability to easily make quick, on-the-fly adjustments
- Expanded visual customization options
- Dash Enterprise v5+ includes internal functions which allow collaborative logic sharing between “owners”
Evolytics is always learning and adopting new data visualization tools and finding fresh ways to expand the possibilities of data storytelling. The days of digging for opportunities in dense rows and columns are over with the right tools or data viz partner.
We use our data visualization expertise, data analysis strategies, and INSIGHT framework to deliver immediate, clear data insights for your team. Your data analysts can stop trying to manually translate your data and instead use data visualization and analysis tools to lay out your data in a way that is easy to understand and share with stakeholders.For more information about any of the data viz tools mentioned above, or to learn more about how Evolytics can help tell your data stories in living color, please get in touch.
Written By

Liam Huffman
Liam Huffman, Data Visualization Specialist, is a Tableau mastermind and Quicksight guru who builds dashboards in support of clients such as the QuickBooks Emerging Markets, Intuit.com, and Intuit Ecosystem Lifecycle Marketing. He has been a primary contributor to the Data-Informed Voter Series and the Evolytics Make a Difference with Diversity Initiative, even volunteering for the Digital Analytics Association Diversity Book Club. When he isn’t visualizing data, Liam is playing with his dogs or teaching swimming lessons at the local YMCA.