Understanding how traffic metrics are defined and measured is key for those starting out on their Adobe Analytics journey—these metrics are fundamental for extracting the actionable insights that guide data decisions. At a high level, Adobe Analytics collects pageviews, visits, and unique visitors as foundational indicators when tracking and reporting website traffic, trends, and overall performance.
PAGE VIEWS
Page views are the most granular measure of web traffic across a site and are represented in Adobe Analytics as the total number of times a page was loaded via server call. Ultimately, a page view is a request for a full-page document rather than an element of a page, such as an image or video. Each time a page loads, the page view count increases. Since page view metrics increment for every page loaded, the page view count produces the highest measurement compared to the number of visits and unique visitors on a website.
For example, if a single visitor viewed fifteen pages during their visit, the resulting number of page views would equal fifteen. Similarly, if a visitor views the same page three times during a visit, those three page views would also be counted. The page view metric is best used with a set time frame in Adobe Analytics. Also note that the number of devices or browsers used by a visitor to engage a website’s content does not impact the measurement of page views when determining how many times a page was loaded.
VISITS
The visits metric is the number of sessions across all visitors on a site. This metric is commonly used when reporting on the number of user sessions within a specified time period.
Each visit consists of at least one hit (an interaction on a site that sends data to Adobe Analytics). Any visit with only a single hit is considered a bounce. Adobe Analytics calculates bounce rate by taking the ratio of visits with only one hit compared to the total number of visits. A session starts when a user first arrives on a site, and ends after one of the following default timeout scenarios:
- 30 minutes of inactivity
- 12 hours of consistent activity
- 2,500 hits
- 100 hits in 100 seconds
- Activity ends in one browser, then starts again in a separate browser (the separate browser counts as a new, independent visit)
After one visit ends, any future activity begins a new visit.
The following scenarios do not start a new visit:
- Users close a tab, then reopen it, and navigate back to site within 30 minutes
- Users close a browser or reboot the computer and returning to the site within 30 minutes
- Users browse a site in multiple tabs with the same browser
A visit isn’t necessarily related to a browser session. For example, if a visitor closes the browser, reopens the browser, then returns to a site five minutes later, the instance is recognized as a continuation of the same visit. Similarly, if a visitor remains inactive on one page for longer than 30 minutes then returns, a new visit begins. The timer expires and resets after another 30 minutes or more of inactivity.
UNIQUE VISITORS
Unique visitors represent the number of de-duplicated visitors to a website over the course of a pre-specified time period and are identified with browser cookies. When we refer to a visitor as de-duplicated, we mean the cookies identifying that visitor are counted only once in that set time period regardless of the overall number of times they visited the site.
For example, a visitor arriving at a site on Monday, Wednesday, and Friday using the same browser will count as only one unique visitor if the time period for measurement is set to one week. You cannot sum visitors over several time periods to get a new measurement because the same visitor can be represented in multiple periods. To evaluate an accurate number of unique visitors, ensure that the time period you want to evaluate is correct for your reporting needs.
In general, if someone visits a site from multiple browsers or devices, or clears a site’s cookies, that visitor will be seen as a new visitor. This will increment the unique visitor counts. Additionally, some browser settings, such as Safari’s Intelligent Tracking Prevition, can result in increased unique visitor counts.
While Adobe uses different methods to identify and count individual site visitors—the most common way involves assigning each user an anonymous identifier, randomly generated and associated with the user’s browser cookies. When a user visits a site and an existing identifier is recognized, it registers as a new and distinct visit for a returning visitor.
Users tend to engage with their online content across multiple devices and browsers, which presents challenges when trying to identify unique visitors solely based on the anonymous identifier. The best way to understand this concept and get an accurate read on user behavior is when a site requires the user to login or enter the site using another form of authentication, assigning a unique identifier to individual users across all visits regardless of browser andor devices. If the user does not actively login on those devices, anonymous identifiers take priority and increment a new and distinct visitor.
DEFINITIONS OF COMMON TERMS
Page Views: Largest Quantity Metric—the number of times a page is viewed.
Visits: Second Largest Quantity Metric—the number of sessions per visitor; one visit consists of at least one or more page views.
Unique Visitors: Smallest Quantity Metric—the number of visitor IDs for a dimension over a set time period. For example, if a user arrives at a site every day for a month, they would count as a single unique visitor.
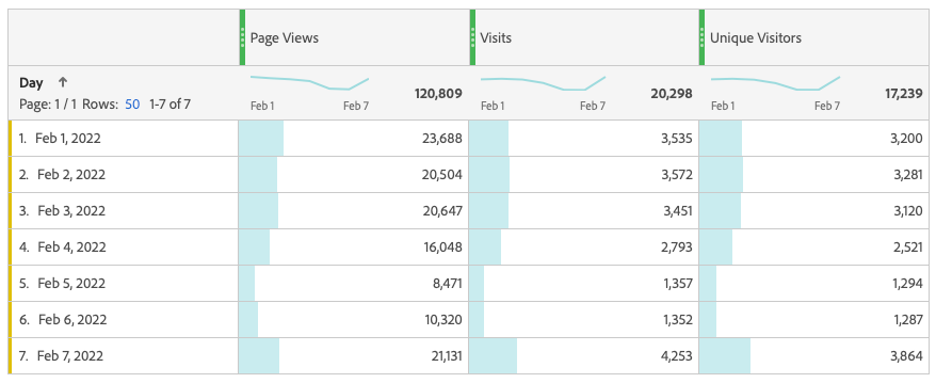
TRAFFIC METRICS VISUALIZED
When viewing these metrics side-by-side we would expect the page views metric to be the largest measure, followed by visits, then unique visitors with the lowest metrics. The table below provides a comparison of these metrics at the daily level.
Evolytics is a Certified Adobe Analytics Partner. We offer extensive Adobe implementation and training support for clients. Contact us if you would like to sharpen your Adobe Analytics skills, or are considering an Adobe Analytics implementation. For additional resources and tips for getting the most out of Adobe Analytics, our blog features additional posts on the topic, and stay tuned for more to come.
Written By

Daniel Ramirez
Daniel Ramirez, Senior Digital Analyst, supports multiple levels of the data lifecycle, leveraging his skills to optimize data-informed decision processes. Daniel specializes in Google and Adobe Analytics, while also performing A/B Testing, SDR development and QA validation.