I Designed an experiment to determine if I’m Evolytics’ best chef
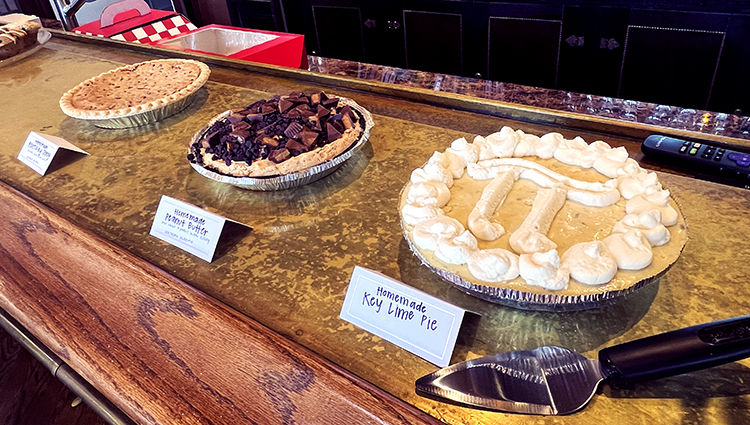
On March 14, 2022, Evolytics team members brought their favorite into the office for our annual Pie Day contest—some competitors brought in homemade pies, while others entered pies from favorite local bakeries. We followed criteria laid out in our previous A/B Testing, Illustrated by Pie blog post to set up the experiment.
This year, the Experimentation Team decided to announce the competition categories ahead of the contest. This introduced the new testing environment as a partially-blind experiment, as opposed to the double-blind experiments in Pi Days past.
Test Design
Objective: Turn the office into a testing environment in celebration of Pi Day!
Hypothesis: If we get to eat pie at work, then our employees will be excited to experience the scientific method first-hand.
Experiment Design:
The pies employees brought were entered represented five different categories to test:
Every employee in the office that day counted as a site visitor. They all were given the opportunity to sample as many different pies as they liked, and voted for their favorites, based on the following categories:
“Better than Mom’s” —Best Homemade Pie
“Leave it to the Pros” —Best Non-Homemade Pie
“It’s a Work of Art” —Prettiest Pie
“First Impressions” —Most Likely to Bring to a Party or Give as a Gift
“I’m Gonna Need Another Slice” —Overall Favorite Pie
Assumptions
- Similar to an online shopping experience, guests had the opportunity to experience any of the pies available on the “site.”
- All guests who came into the office on this day represent the audience, or site visitors.
- Guests are only exposed (via tasting) to those pies that they are “shopping for” (interested in).
- A vote for a pie that they were exposed to represents a conversion.
Biases
In an office environment, guests may feel obligated to vote for their favorite co-worker’s pie, or maybe even the CEO’s pie submission. The anonymous nature of the voting likely helped counteract this, but we cannot fully correct for this bias. We’ll consider it akin to brand loyalty for the sake of our eCommerce example.
Guests with allergies or dietary preferences likely didn’t try all (or any) of the pies. Many of the pies contained tree nuts, dairy, and gluten—they all contained lots of sugar.
Additionally, the pies were placed in a buffet line, where guests were encouraged to start at the end near the plates and silverware; pies towards the end of the line may have had a decreased “conversion” opportunity if a guest’s plate was full by the time they reached that point.
Pie testing also occurred right after lunch. The principle of diminishing marginal utility played a starring role in our experiment. The more pieces of pie guests tried, the less delicious they became. The pie that guests were most excited to try was likely their first bite, and likely their favorite was picked early on in the order of pies they tried. By the time they got to the end, their palette was no longer clean and unbiased, and full of sugar. Also, mixing key lime pie, apple pie, and peanut butter pie sounds can be a flavor explosion nightmare.
Results
“Better than Mom’s” — Best Homemade Pie
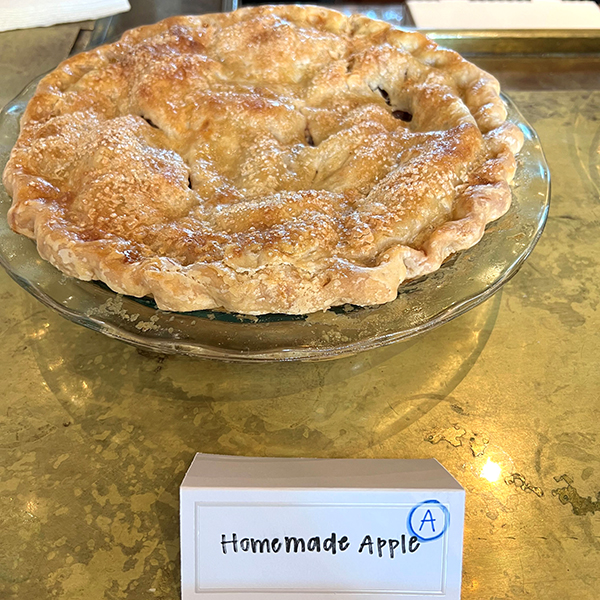
Winner: Dan, Apple Pie
Statistically Significant? Yes.
Conversion Rate: 50% (Vote Receipt) at 97% Confidence
“Leave it to the Pros” — Best Non-Homemade Pie
Winner: Tom (our CEO!), Apple Pie
Statistically Significant? No.
Conversion Rate: 29% (Vote Receipt) at 67% Confidence
“It’s a Work of Art” — Prettiest Pie
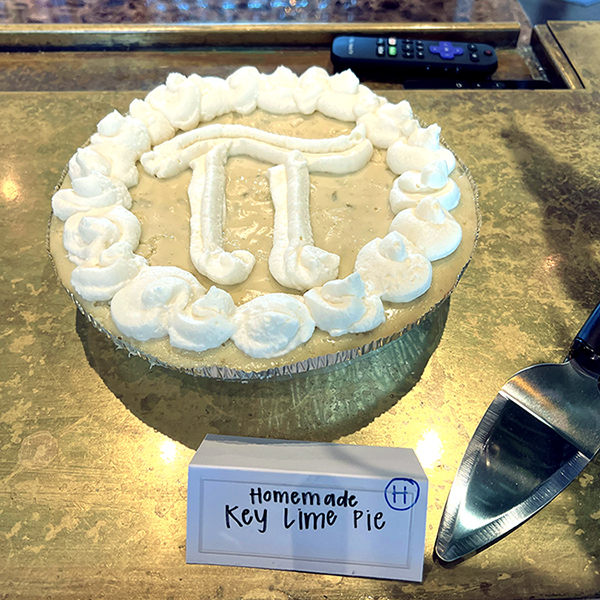
Winner: Liz (me!), Key Lime Pie
Statistically Significant? No.
Conversion Rate: 29% (Vote Receipt) at 38% Confidence
“First Impressions” — Most Likely to Bring to a Party or Give as a Gift
Winner: Leah, Peanut Butter Pie
Statistically Significant? Yes.
Conversion Rate: 50% (Vote Receipt) at 97% Confidence
“I’m Gonna Need Another Slice” — Overall Favorite Pie
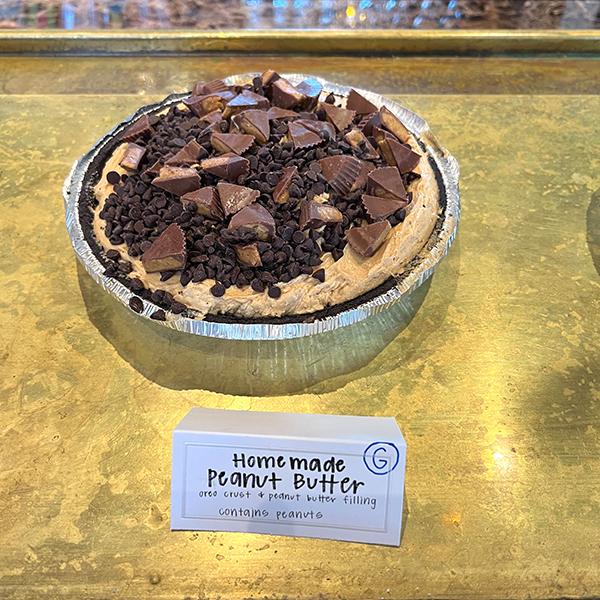
Winner: Leah, Peanut Butter Pie (Same as pictured above)
Statistically Significant? No.
Conversion Rate: 36% (Vote Receipt) at 31% Confidence
Learnings
Two pies won with statistical significance: Dan’s “Better than Mom’s” Apple Pie and Leah’s “First Impressions” Peanut Butter Pie. We did not find a clear winner for the “Leave it to the Pros,” “It’s a Work of Art,” or “I’m Gonna Need Another Slice” categories.
We introduced a few different variables into the experiment this year, but need to make a few tweaks before our next iteration.
Enhanced tracking and measurement planning is essential to capturing the most accurate and usable data. We need to ensure that we are learning from each and every user who tasted a pie. A few users got away without voting!
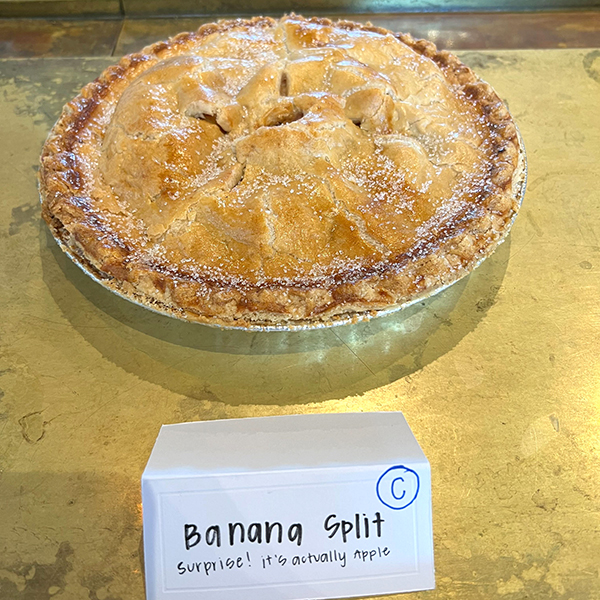
We need to find a way to control the different types of pies tested. We had three delicious apple pies, a fan favorite and all around classic pie. While each pie was delicious in its own way, users may have experienced apple pie fatigue. The first pie in the lineup was missing the most slices, followed by the second apple pie, and the third apple pie was only tried by a handful of users. This corroborates our theory that order and proximity to plates and silverware did, in fact, impact interactions (pie sampling).
Written By

Liz King
Experimentation & Strategy Analyst