This data visualization gets under the hood of the College Basketball Game Predictor’s Elo model
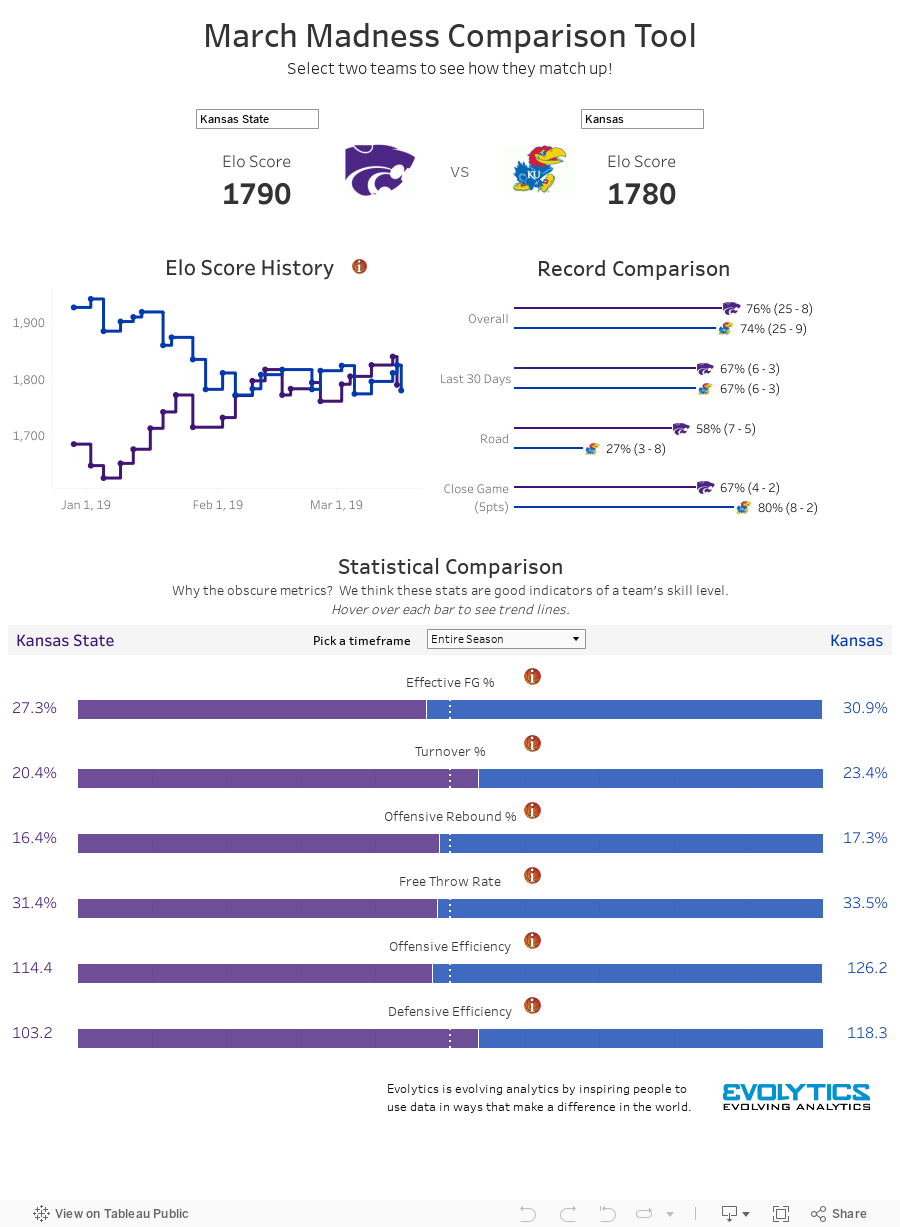
Just in time to fill out those last minute college basketball tournament brackets or adjust completed ones, the Evolytics College Basketball Game Predictor is here, and it has enhancements! We made a Tableau dashboard to help you compare teams using the statistics utilized in our Elo model.
The dashboard also shows the Elo rating for each team over the course of the season along with a few key record statistics.
Good luck on your brackets!
Written By

Jay Farias
Data Visualization Manager Jay Farias is a technology enthusiast who specializes in Tableau. He has years of experience implementing innovative technology solutions in the construction and healthcare industries. He supports Data Visualization strategy and implementation for Kantar Health and Intuit.