This post is part of our Six Favorite Tableau Tips, Tricks and Hacks to Enhance Dashboards collection.
Conditional formatting, or color-coding functionality, in Tableau adds visual cues to the insights in our analysis. Especially for users transitioning to Tableau from Excel-based reports who still want all number values visible in a dashboards, adding color to these values helps easily identify significant changes in performance.
Tableau offers a variety of built-in color palettes to find insights through color in visualizations. While these color palettes work well in many cases, sometimes you need to adjust color palettes based on specific targets and business requirements.
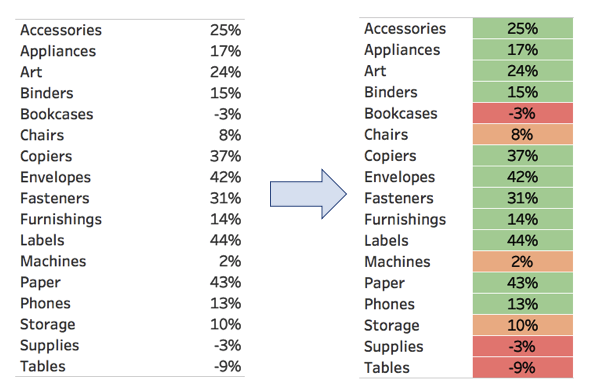
For example, imagine our business goal is to be more than 10% profitable. We would want to identify non-profitable product categories as red, less than 10% profitable as orange, and more than 10% profitable as green.
One way we could solve this is by writing a calculation to specifically define these ranges. While this is a good option, it doesn’t scale easily. If we want to evaluate the performance of more than one metric, we would need to create a conditional color calculation for each individual metric and then manually adjust colors for each.
There is a more scalable option however. We can create a custom color palette to fit the performance scale perfectly, which will be available in the custom palette dropdown any time we want to use it.
Creating Custom Step Palette to Analyze Business Performance
Step One: Find the Settings for Custom Step Color Palettes in Preferences.tps
To create a custom color palette, you first need to find the My Tableau Repository folder on your computer. When Tableau is installed on a computer, My Tableau Repository is automatically created in your My Documents folder, containing all Tableau-related documents and settings. Navigate to your Preferences.tps file which holds all your custom palette codes. Open the Preferences.tps file in notepad or any other text editor.
My Documents >> My Tableau Repository >> Preferences.tps – open in a text editor
Step Two: Determine the Scale of the New Custom Palette
It is now important to decide how many steps the custom palette should have. The number of steps depends on the business question we’re trying to answer.
Based on the business requirements, we know that any values below 0 should show as red, which means our first step color should be red.
Values from 0-0.1(10%) should be orange, which gives us 10 steps of orange.
Finally our last step will represent any value above 0.1(10%) and should be green.
The palette will have a total of 12 color steps.
Step Three: Create the Code for Custom Step Color Palette
The color palette code starts with an opening color tag where we name the custom palette and set its type to ordered-sequential. Make sure to close the code at the end with a closing color palette tag.
<color-palette name=”Profitability” type=”ordered-sequential” >
</color-palette>
Between the opening and closing tag we place the color steps for the custom palette.
We need to identify the hex color codes for the colors used in the custom color palette. The color picker on Google is an easy way to do this. Select any color and the tool provides the hex color code. For this example, we need red #ff0000, orange #fc6e16, and green #40b23a. Put the color steps within the opening and closing tags based on the sequence identified earlier: 1 step of red, 10 steps of orange, and 1 step of green.
<color-palette name=”Profitability 12 Step: -.01 to .11″ type=”ordered-sequential” >
<color>#ff0000</color>
<color>#fc6e16</color>
<color>#fc6e16</color>
<color>#fc6e16</color>
<color>#fc6e16</color>
<color>#fc6e16</color>
<color>#fc6e16</color>
<color>#fc6e16</color>
<color>#fc6e16</color>
<color>#fc6e16</color>
<color>#fc6e16</color>
<color>#40b23a</color>
</color-palette>
Paste the custom color palette code into the Preferences.tsd file after the following opening tag:
<?xml version=’1.0′?>
<workbook>
<preferences>
Save changes made to Preferences.tsd. Make sure to close and reopen your Tableau workbook to refresh the available color palettes.
Step 4: Apply New Custom Step Color Palette to Visualization
Add Profit Ratio to the color, making sure to also leave it on the label to show the numbers. Change the mark type from Automatic to Square to apply color the background of the numbers.
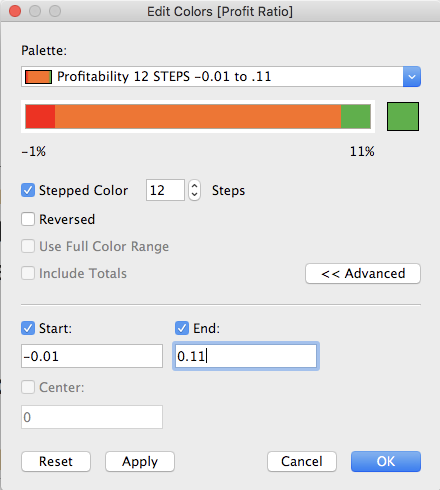
Now we will need to change the color palette used from the Automatic palette assigned to the visualization to the Profitability custom palette we created in the previous step. Go to color, edit the color, and select the Profitability palette from the drop down.
We now need to adjust the settings of the Profitability color palette to the required range and steps. Change the Stepped Color setting to 12 steps. Set the Start to -.01 and the End to .11.
After applying the color palette to Square marks by default, we have very bright colors and no space between rows. We can apply a few updates to the formatting to make the visualization look better:
With the help of conditional formatting based on business goals, we can now easily identify all unprofitable product categories. We can also easily identify product categories that bring less than 10% profit and more than 10% profit.
This same color-coding method can be applied to year-over-year (YOY) performance analysis and designed around other types of goals and key performance indicators. The number of steps in the color palette must be adjusted based on your goals and related goal thresholds.
For example, you can use a similar approach to create a 100-Point Stoplight index for YOY performance analysis. We hope this inspires you to think of other creative ways to use custom color palette as well!
Final Workbook on Tableau Public
Written By

Evolytics
This post is curated content from the Evolytics staff, bringing you the most interesting news in data and analysis from around the web. The Evolytics staff has proven experience and expertise in analytics strategy, tagging implementation, data engineering, and data visualization.