Maps, which were introduced with Tableau 4.0 in August 2008, are one of the most powerful visualization types available.
The power of maps comes from their inherent ability to leverage schemas that you have been building up for many years.
In the Data-Driven Storytelling tip, Eliminate Chart Junk (but Not Graphics), we showed how an image of a map helps you decode dozens of Latitude / Longitude pairs almost instantly.
This post shares how to harness this power by creating symbol maps and how to take your maps a step further by integrating Tableau with beautiful Mapbox maps.
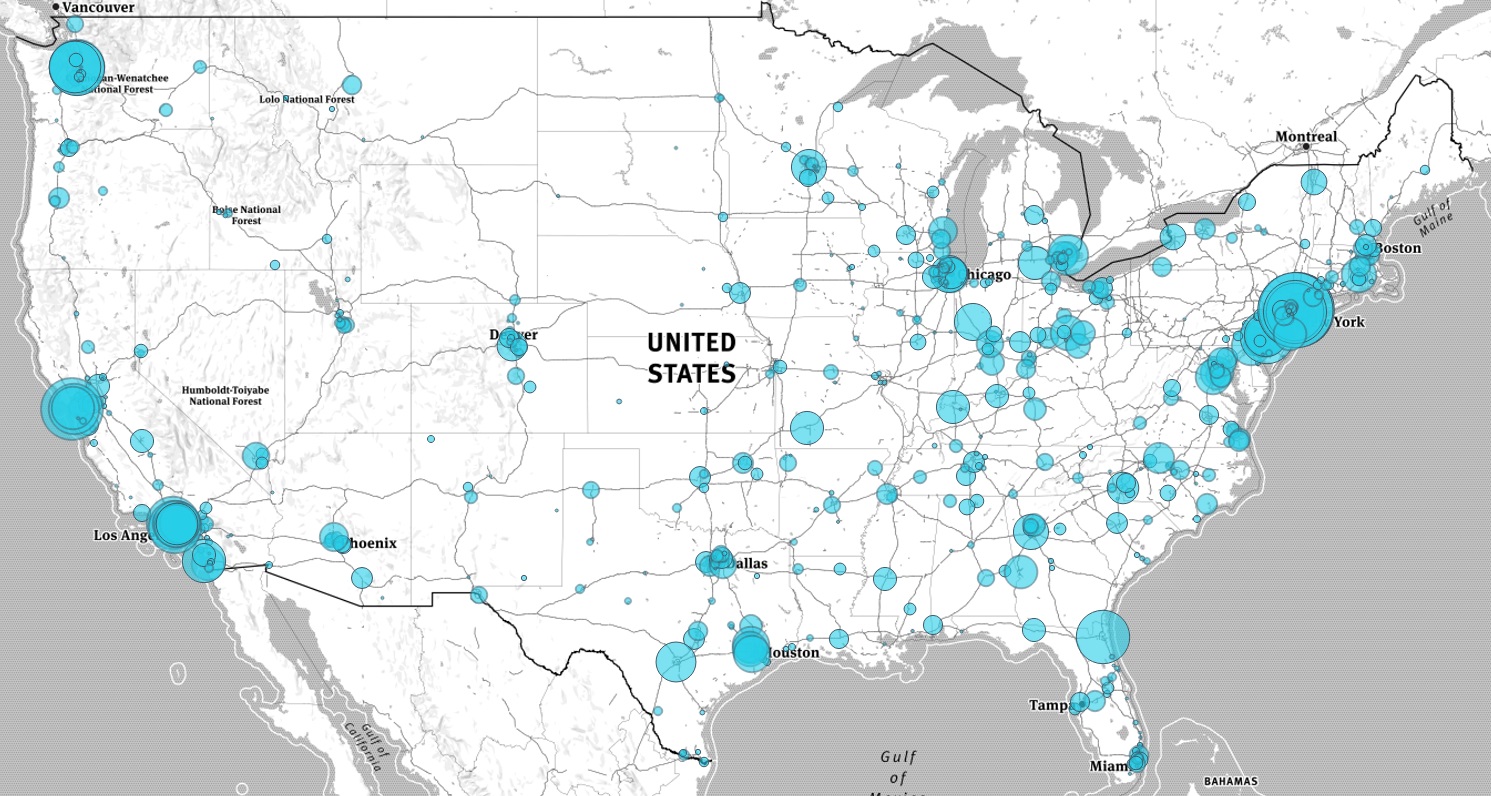
First, let’s take a look at how our final map example will look:
This tutorial uses the Sample – Superstore data set.
How to Make a Symbol Map in Tableau
The easiest way to start a symbol map in Tableau is to double-click on a geographic dimension from the dimensions shelf on the left-side of the interface. You know that Tableau recognizes your geographic fields as map-compatible if there is a globe icon next to the dimension.
In our example, we are going to double-click on Postal Code to start the view.
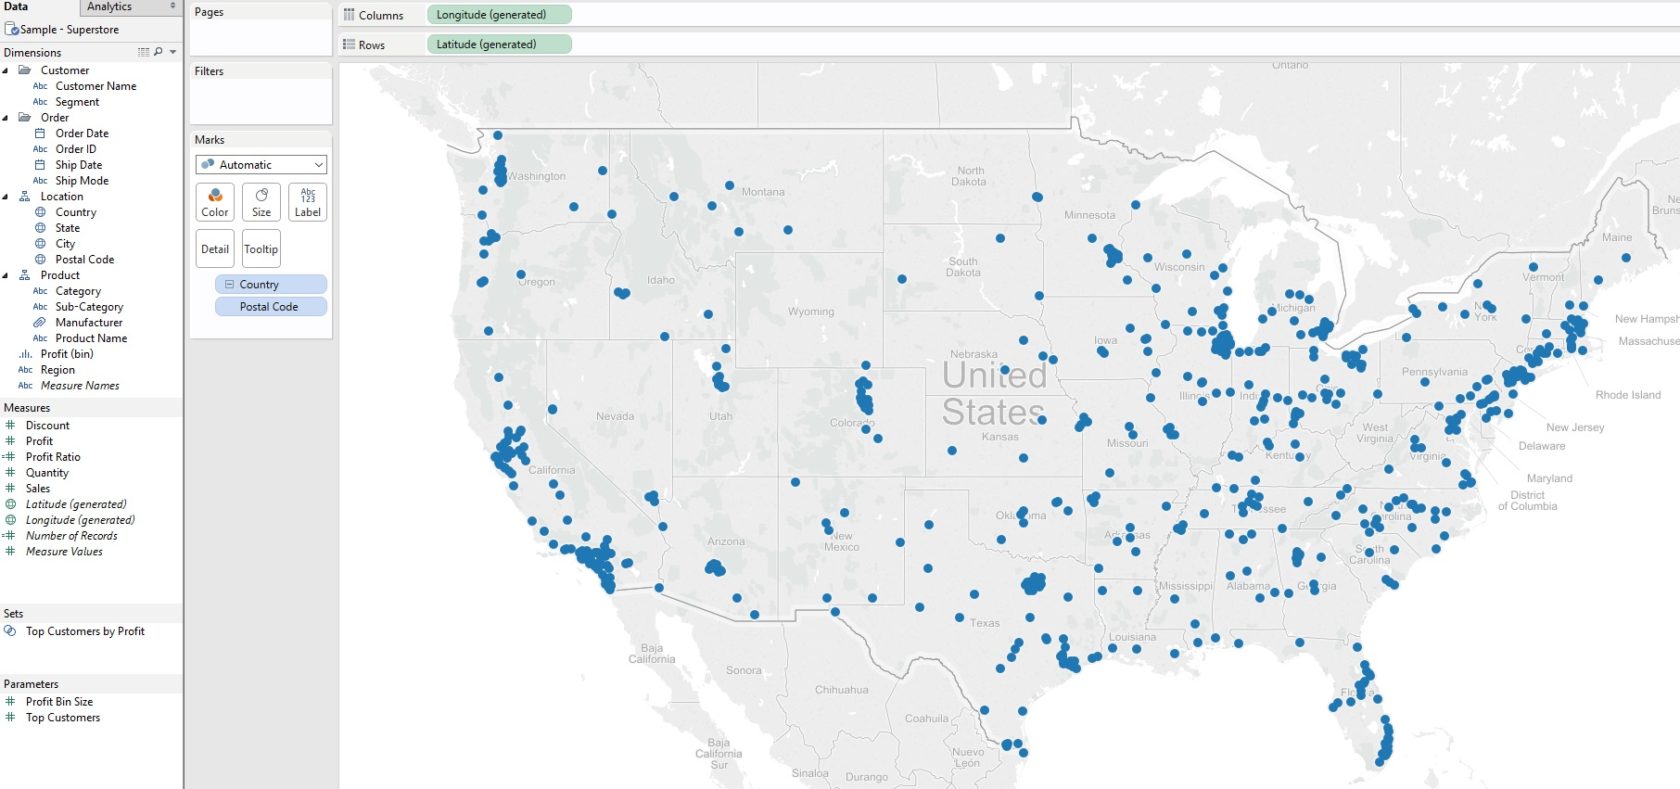
Notice that Tableau put Longitude on the columns shelf and Latitude on the rows shelf, and each circle represents the intersection of each pair.
At this point, we technically already have a symbol map, but there are several ways we can add value to the visualization
You may want to change the ‘symbol’ from the default circle to a square or other shape.
Perhaps you want to size and/or color the symbols by a measure such as sales by placing measures on the appropriate marks cards.
We like the default circles because you can add a border and they look nice with transparency, so we are going to stick with that.
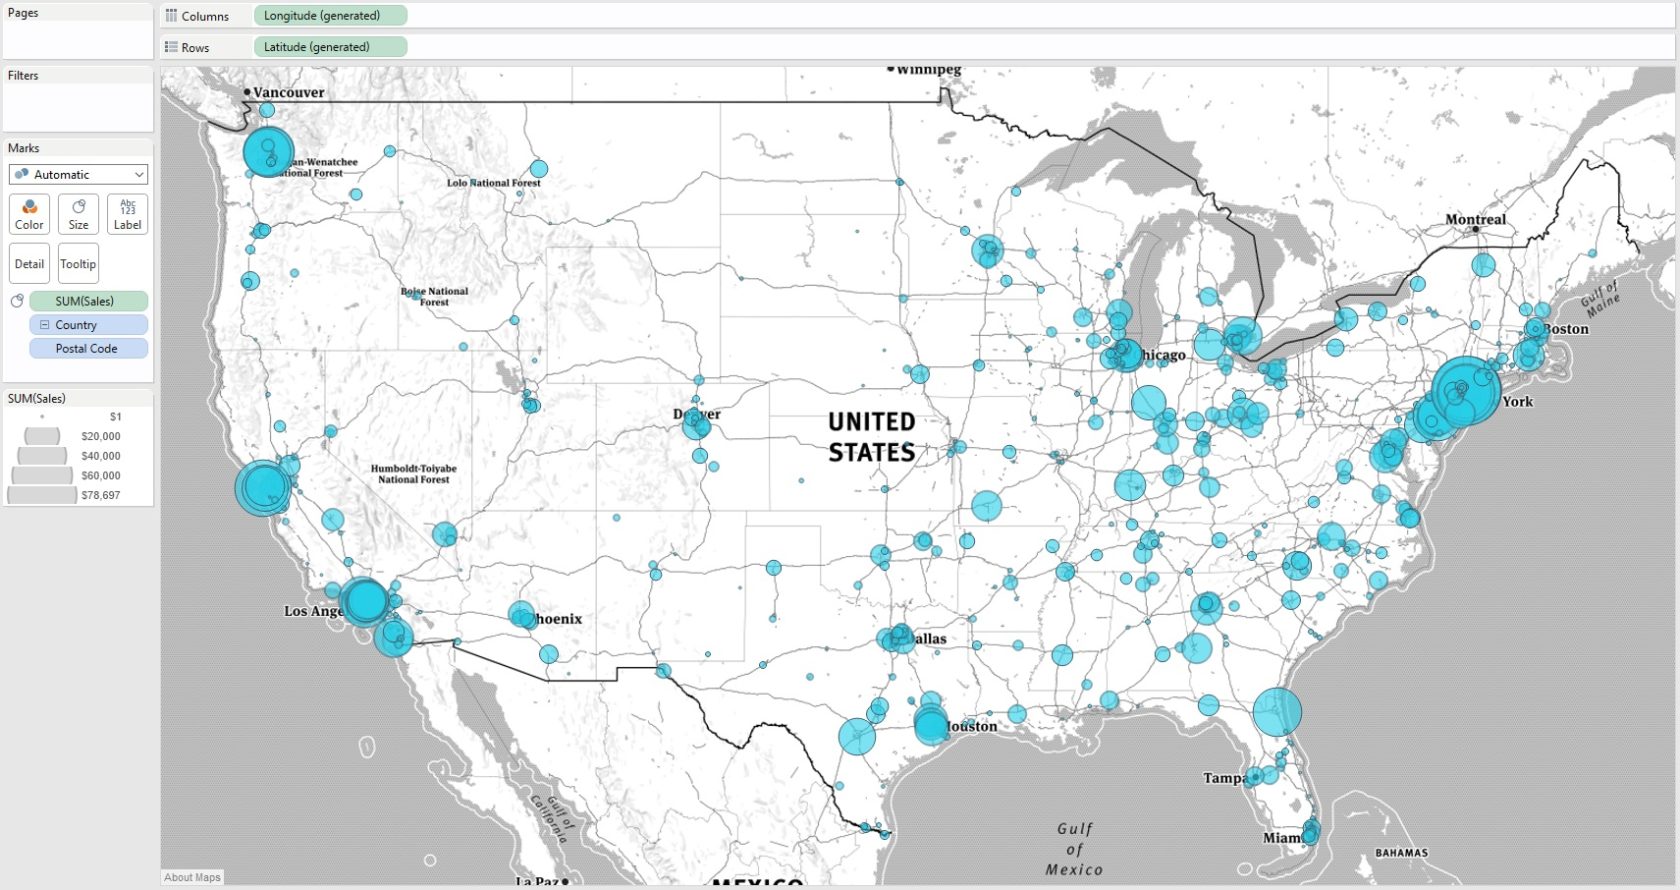
We will change the color to something that pops more by clicking on the color marks card and size the bubbles by sales by placing that measure on the size marks card.
At this point, our view looks like this:
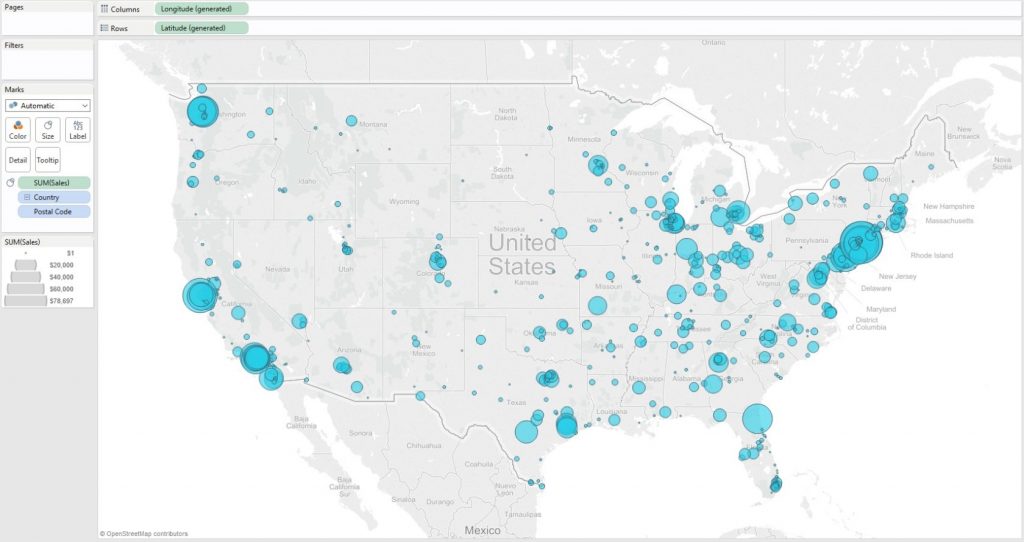
This is a solid symbol map at this point, but you can also add additional data layers or choose from three map styles by navigating to Map > Map Layers.
How to Add Mapbox Maps
Tableau provides three map styles out of the box, but starting in Tableau version 9.2, it is very easy to integrate your Tableau workbooks with Mapbox, a custom map designing service, to access 14 additional map styles.
In order to access these new styles, follow these simple steps:
- Go to mapbox.com
- Signup via the button in the top right corner
- Once you’re signed up, navigate to the Home tab, and copy your access token on the right side
- From within your map view in Tableau, navigate to Map > Background Maps > and click Map Services
- From the new dialog box, click ‘Add…’ and choose ‘Mapbox Maps’
- This is where you give your custom map a name, paste your access token, and choose one of the styles
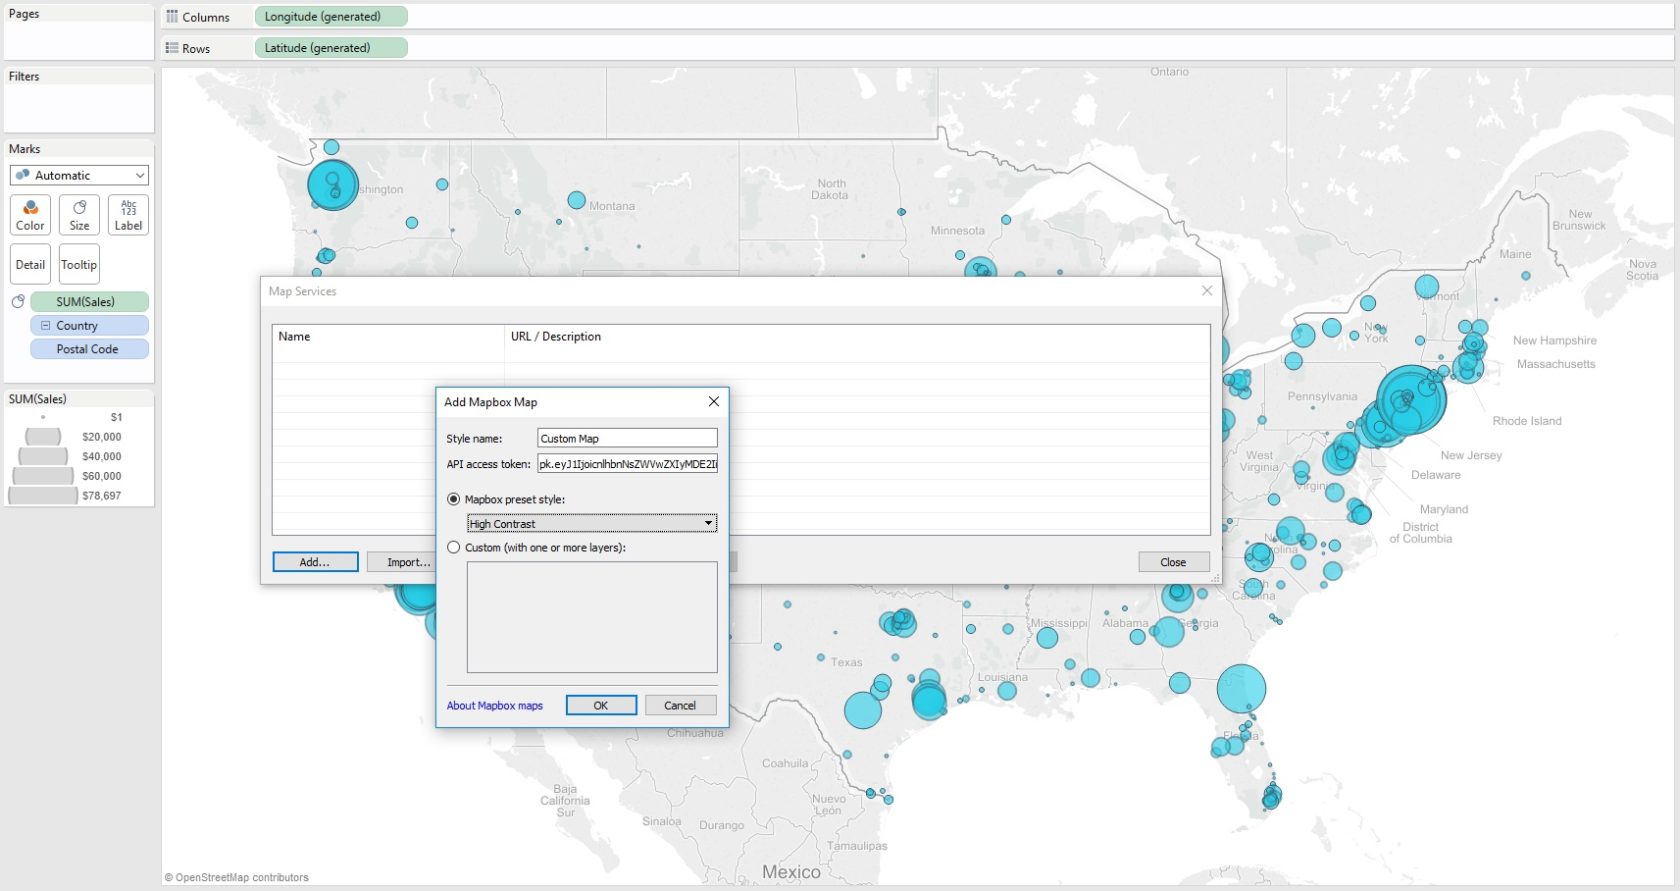
For our example, we chose the high contrast Mapbox style, but there are 13 additional styles to choose from!
After clicking ‘Okay’ and closing the dialog box, we are left with a nice-looking Tableau symbol map with an integrated Mapbox style.
Written By

Evolytics
This post is curated content from the Evolytics staff, bringing you the most interesting news in data and analysis from around the web. The Evolytics staff has proven experience and expertise in analytics strategy, tagging implementation, data engineering, and data visualization.