
If you are a first time Tableau user, the authoring interface can feel like an intimidating place. Without at least a quick tutorial, it can be very challenging to know how to even get started.
We have had a similar feeling with several other software products such as Photoshop, Illustrator, and AutoCAD.
That being said, we have found the Tableau interface to be the most intuitive of all of them. Once you have a grasp on the nomenclature and location of key features, you will find that not only do the terms make sense, but you’ll also have an understanding of how Tableau looks at the fields you’re using to generate each visualization.
This post provides an overview of the Tableau interface, terminology, and a couple of things that we like to do first whenever we start working with a new data set.
While this is certainly not an exhaustive list, it will help you get started authoring in Tableau immediately and will provide a foundation for what’s to come.
Tableau Terminology
To walk through some of the most important Tableau terminology, we will use the following key followed by names and definitions:
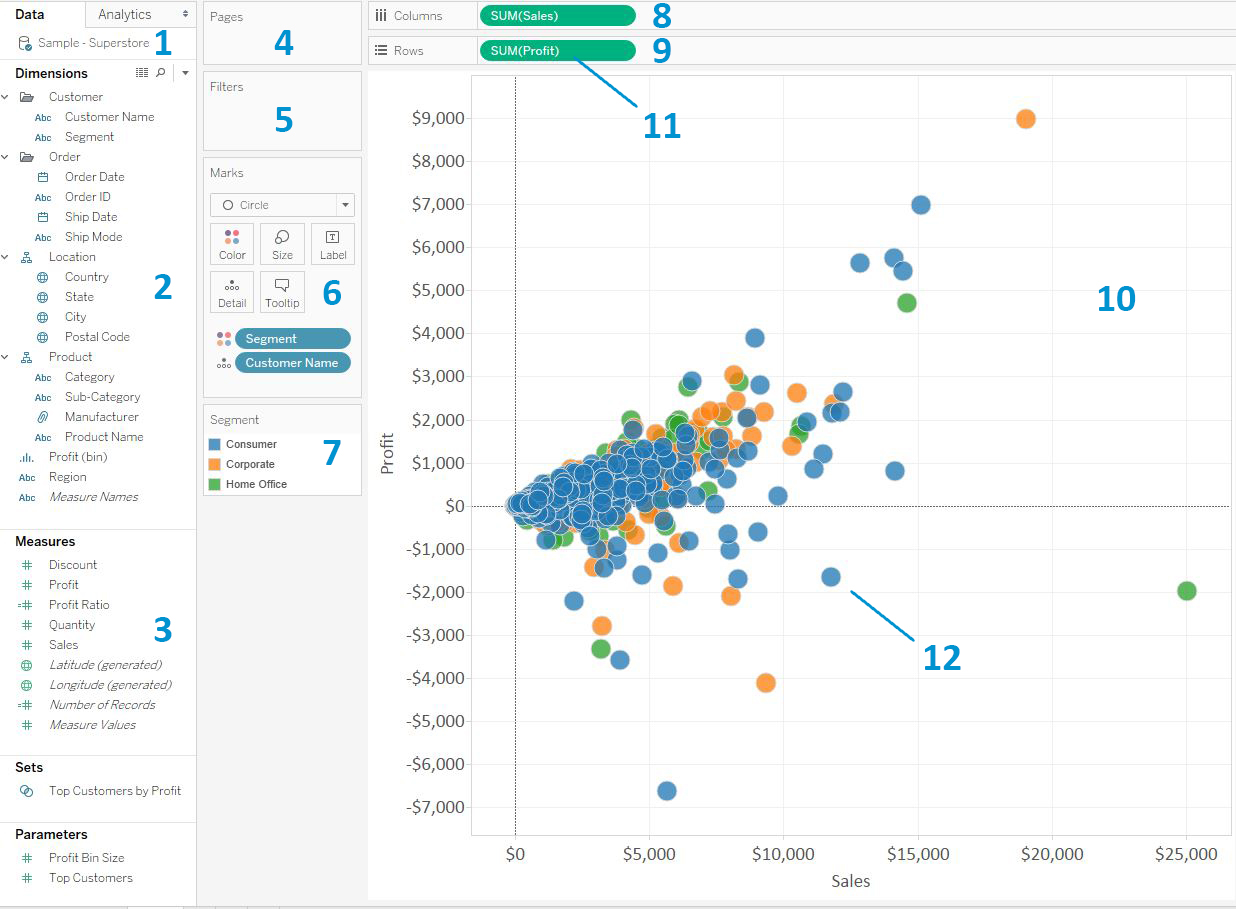
- Data Window – Displays all of the data connections in the workbook. Note that only one data connection (Sample – Superstore) is being displayed in this example, but you can connect to more than one data source.
- Dimensions Shelf – A list of all of the fields in the data source classified as dimensions.
- Measures Shelf – A list of all the fields in the data source classified as measures.
- Pages Shelf – The Pages Shelf allows you to pivot through dimension members and/or add animation to a view. For example, you can put a dimension for Month of Order Date onto the Pages shelf and have the view rotate through one month of data at a time.
- Filters Shelf – Any dimension or measure that is filtering the view will be displayed here.
- Marks Card (Marks Shelf) – Each square in this area is called a Marks Card, which are called that because they influence the marks on the view. Each Marks Card resides on the Marks Shelf. Note that depending on the chart type you are creating, additional cards will show up such as for Shape or Path.
- Legend – There are several different legends that will appear here to show how the marks are encoded including Color (pictured), Size, and Shape.
- Columns Shelf – Fields placed here will create columns on the view.
- Rows Shelf – Fields placed here will create rows on the view.
- Worksheet / View – Each tab in a Tableau workbook is called a worksheet and the area that displays a data visualization is a view.
- “Pill” – The slang term for fields being used on a worksheet.
- Mark – Each data point on the view.
We will close this post by sharing two things that we like to do when we open a new data set in Tableau
View the underlying data
If we are working with a new data set that has been provided to us, we like to get a general feel for the types of data each field provides.
You can easily view this in a tabular form in Tableau in a few different ways:
- Right-click on the data connection in the data window and choose “View Data…”
- Click Data in the top navigation, hover over the data connection, and choose “View Data…”
- Click on the first tab in the bottom of the worksheet view
Whichever method is used, this provides a snapshot of the data so that you can get a general feel for the types of data that are available, if some fields contain nulls, what fields may be most useful to ‘slice and dice’ your measures, etc.
If you want to look at one field at a time, a handy trick is to right-click on that field on the Dimensions / Measures Shelf and choose “Describe…”. A window will pop up to provide you with helpful information about the respective field.
View the Number of Records
If you look at the bottom of the list of measures on the Measures Shelf, you will see a field called Number of Records. This is a special field that Tableau automatically generates for you, which is indicated by the italic formatting.
Number of Records is actually a calculated field that simply equals 1.
What this does is adds a column with an entry of 1 to each row of your data, so Tableau can count the number of records in the data set.
To view how many records are in your data set, go to a new worksheet and drag the Number of Records field to the Text Marks Card.
We like to do this when we are getting started with a new data set for two reasons:
- This provides a quick quality assurance check.
- For example, if the number of records is lower than you expected, you may need to ensure you haven’t filtered the data set or that the data provider gave you the correct output.
- Having a ballpark idea of the number of records in a data set can provide a clue on whether we need to take extra steps to keep the workbook running efficiently.
- If we find that we are working with a very large data set, we may consider additional ways to aggregate the data and / or keep the size of the data in mind when creating calculated fields (as some are more efficient than others).
After we have got a feel for the size of the data and the type of data we have available, we start creating views and doing some discovery analytics, which we will discuss in future posts.
Written By

Evolytics
This post is curated content from the Evolytics staff, bringing you the most interesting news in data and analysis from around the web. The Evolytics staff has proven experience and expertise in analytics strategy, tagging implementation, data engineering, and data visualization.