
Tableau sets allow you to isolate specific segments of a dimension, and can then be used in several different ways to find insights in your data. This post provides instructions on how to build sets as well as five different ways they can be used to enhance your analyses.
Sets can be thought of as custom segments, but unlike dimension fields, they are always binary. In other words, you are either in the set or not. Other than that one restriction, sets can be created for just about anything. You can pick individual dimension members to place in a set, have sets be based on quantitative thresholds, created with the top or bottom performing dimension members, and more.
How to Create a Set in Tableau
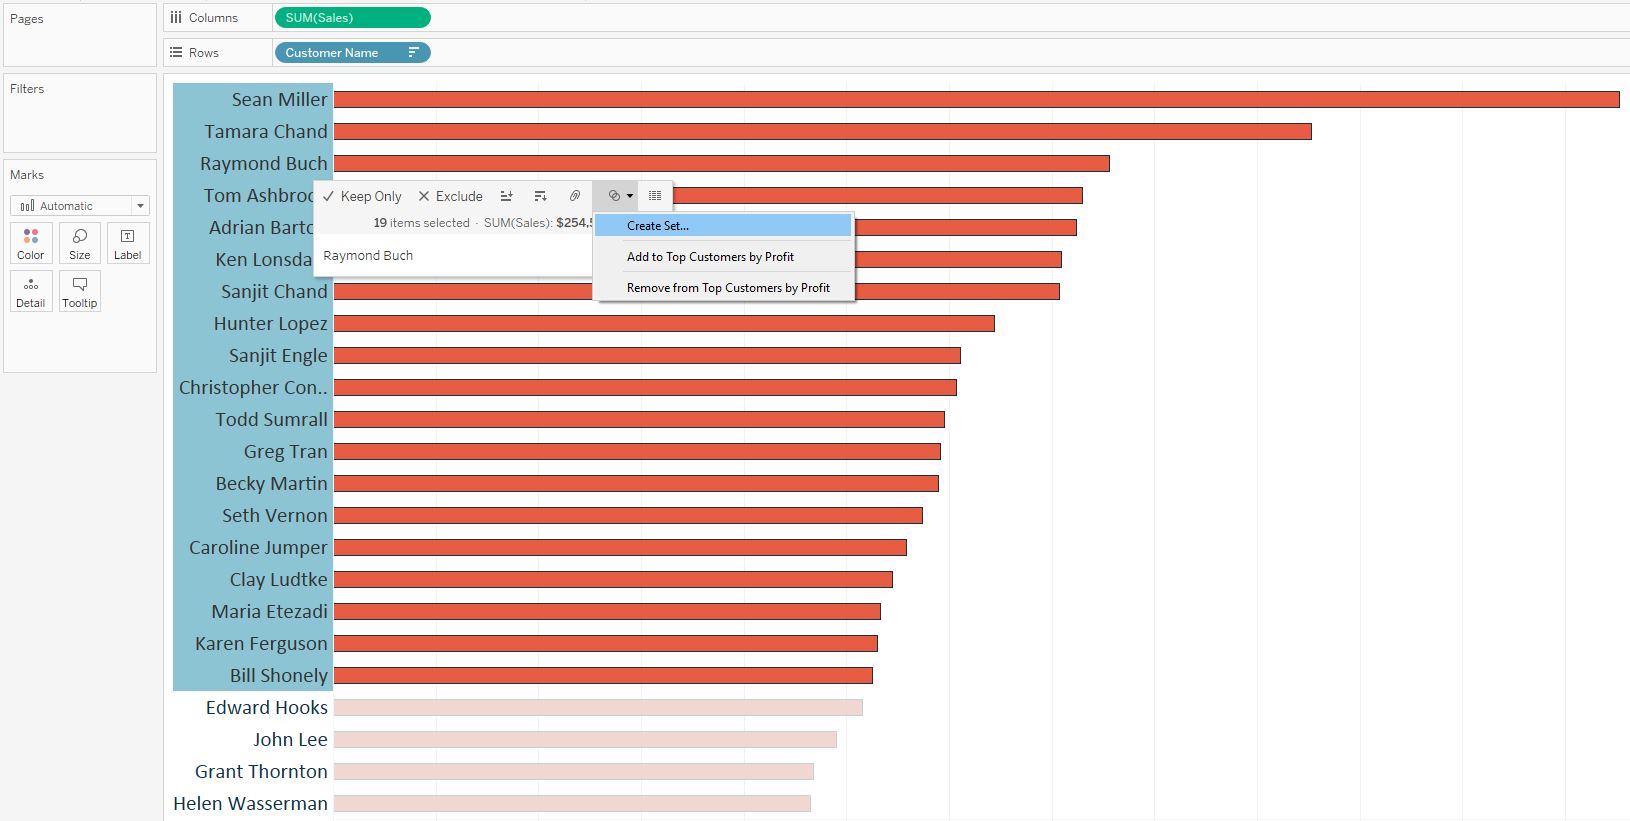
Similar to creating filters in Tableau, sets can be created in a couple of different ways. The first, and most straight-forward method is to simply select the dimension members on a view, then hover over one of the dimension members, click on the Venn diagram icon that appears, and choose “Create Set…”. Here’s what that would look like if we wanted to create a set from the top 20 customers by sales in the Sample – Superstore data set.
After clicking on “Create Set…” and giving the set a name, the set will appear on the Sets Shelf on the left side of the authoring interface. This set that tells us whether each customer name is in or out of the top 20 customers by sales is now available to use in our analyses. Note that sets created with this method are static, so the top 20 will not dynamically change should a new customer enter the top 20.
You can also create a set by right-clicking on the dimension the set will be created from on the Dimensions Shelf, hovering over “Create”, and clicking “Set…”. After following the preceding steps on the Customer Name dimension, the following dialog box appears:
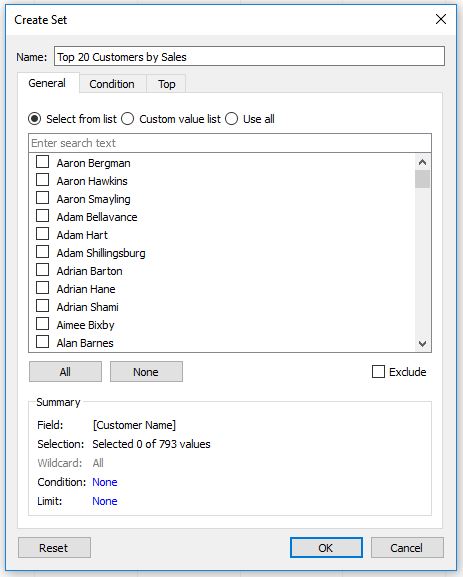
The first tab provides the ability to manually pick and choose the dimension members to be included in the set as we have done with the first method above. The remaining two tabs can be used to base the set on a condition or ‘Top N’, respectively. Computed sets like this will dynamically change when the data set is updated. Whichever method you choose to create your set, a new field will be created to use in the following examples.
Five Ways to Use Tableau Sets
1. As a filter
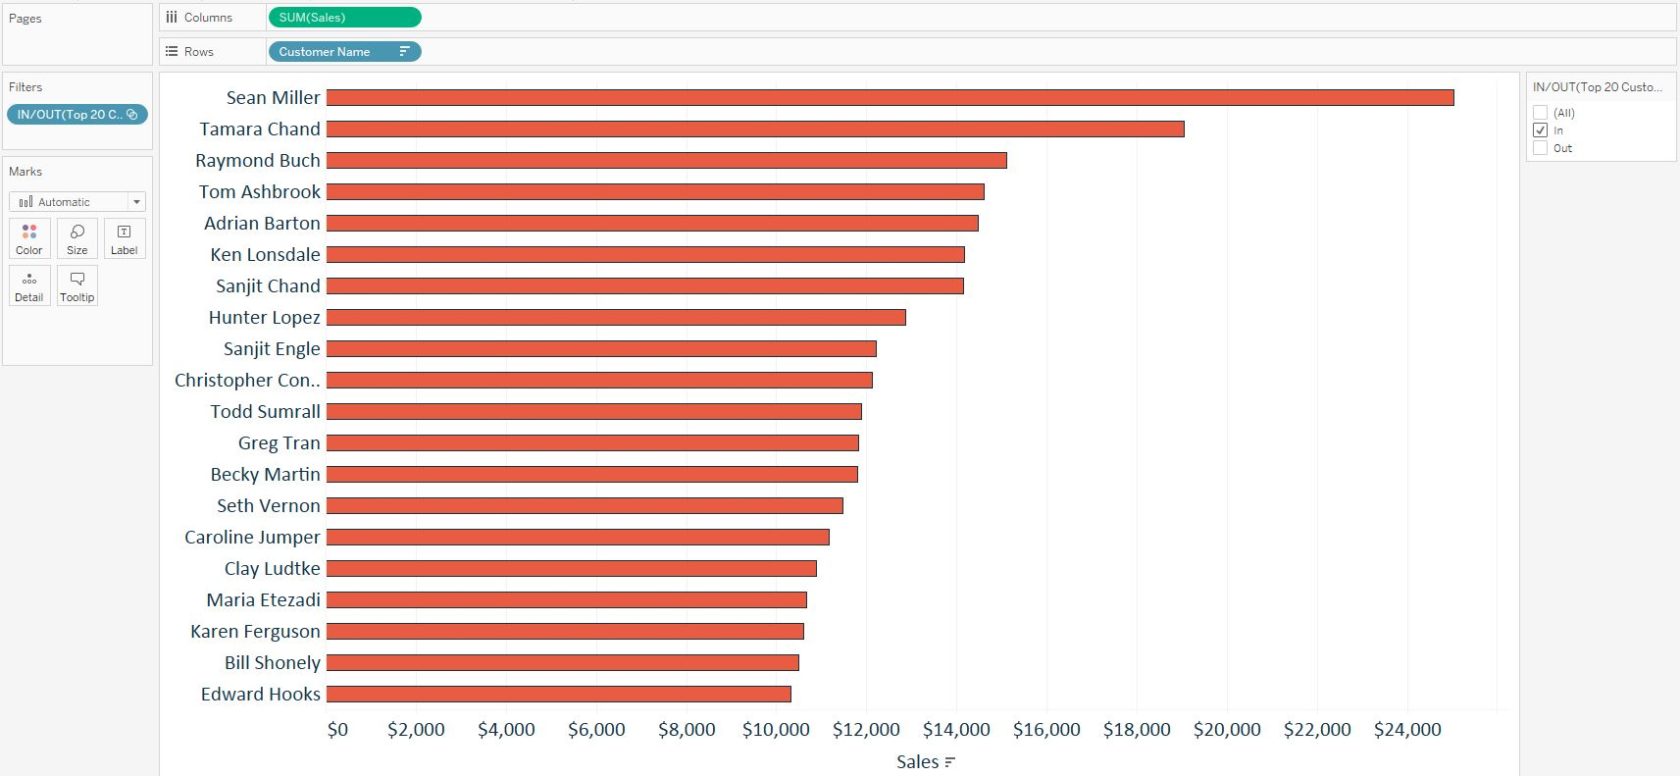
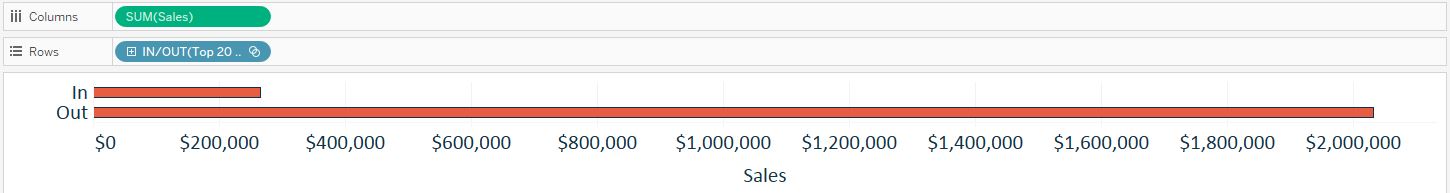
Sets can be used as a filter by right-clicking on a set from the Sets Shelf and choosing “Show Filter”. Sets are binary, so when you add them as a filter, you will only have the option to choose whether the marks on the view are in or out of the set. Here’s how my bar chart of sales by customer name in descending order looks after showing the filter for Top 20 Customers by Sales and keeping only the names that are in the set.
2. To encode marks
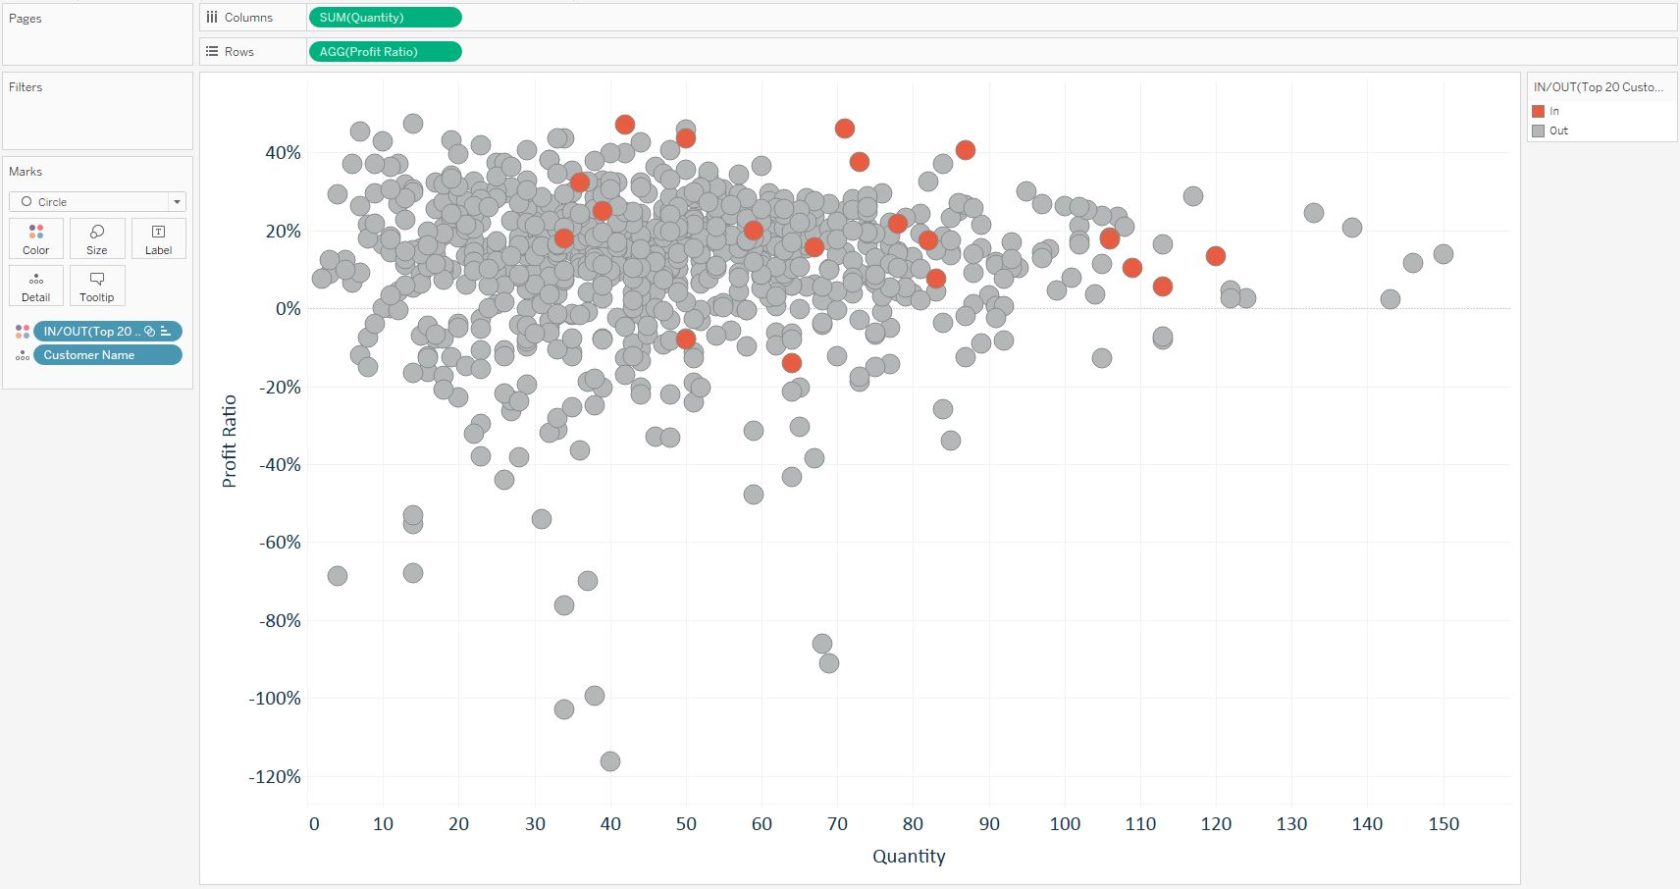
You can encode marks on a view by a set by dragging the set from the Sets Shelf to the Color Marks Card. Here’s an example where we’ve done this to make the top 20 customers by sales stand out on a scatter plot.
3. In calculated fields
Sets can be used in calculated fields just like dimensions or measures. This way you can treat dimension members differently based on whether or not they are in a set. Here is a simple example being used to rename the sets:
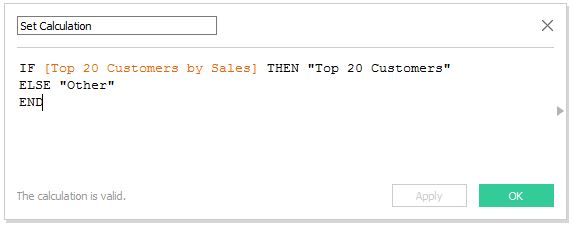
This formula is saying that if a customer name is in the set, name the set “Top 20 Customers”; otherwise call it “Other”. Note that this example is used to show you that sets can be used within calculated fields, but this same renaming could have been accomplished by editing the aliases of the set.
4. As dimension fields
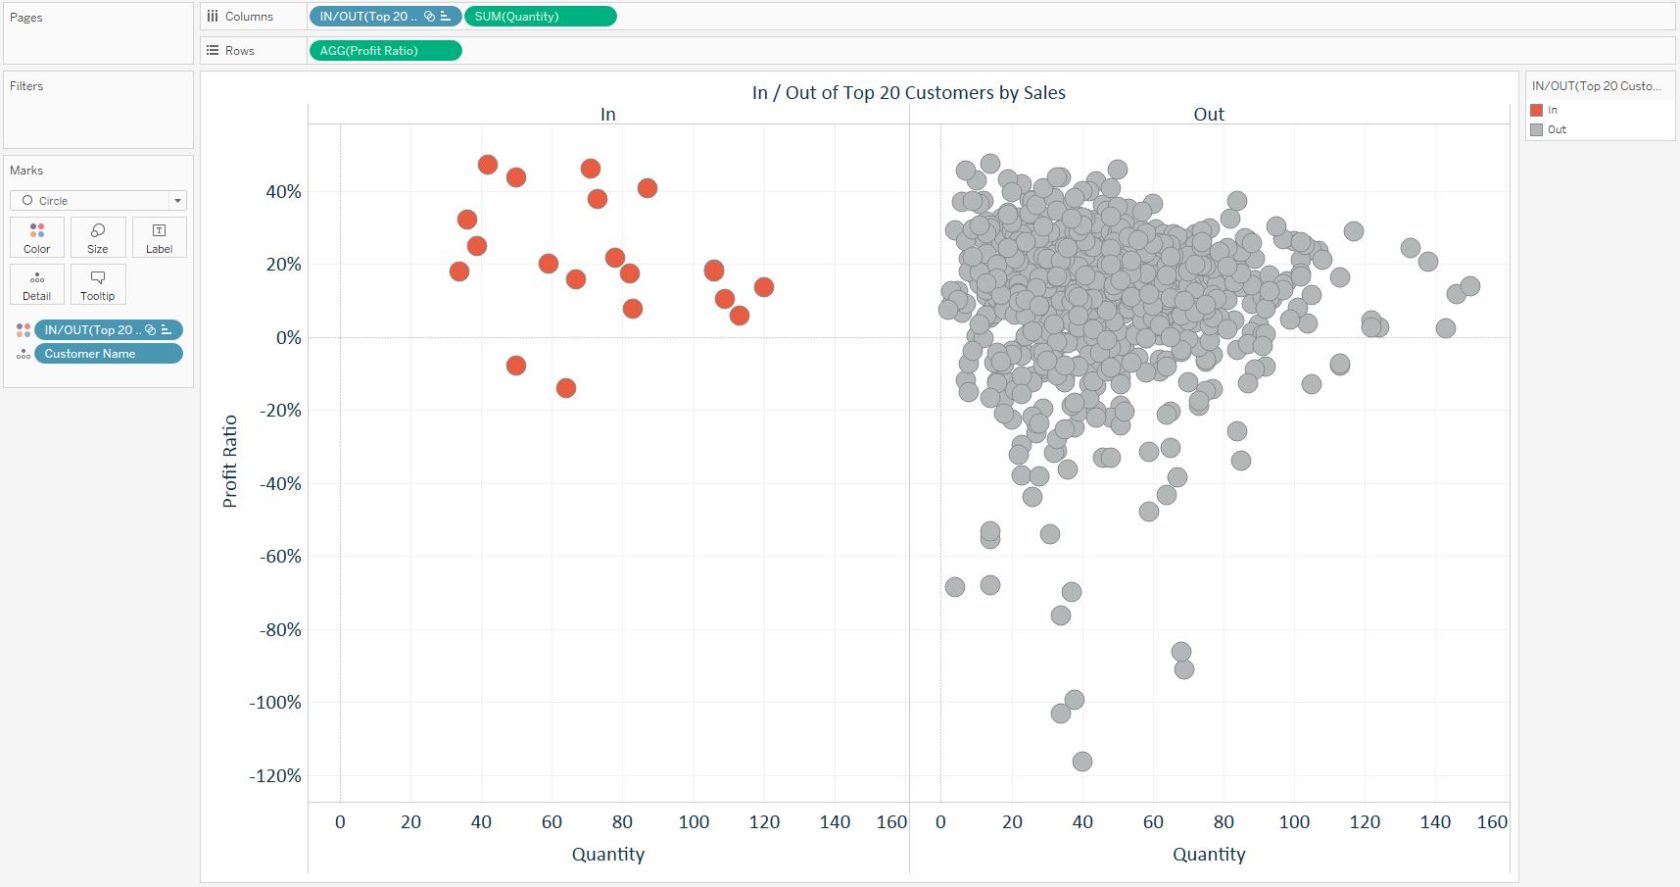
Sets can be used just like dimensions in that if you add a set field to the Columns Shelf or Rows Shelf, the view will be ‘sliced and diced’ by that field. Here is how our scatter plot from earlier looks if we create two separate columns for in and out of the set by dragging the set from the Sets Shelf to the Columns Shelf.
5. Within a custom hierarchy
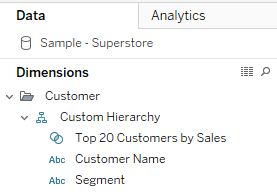
Sets can be used as part of a custom hierarchy in Tableau, which allows you and your end users to easily drill down and back up across different dimensions. For example, you may want to create a hierarchy with customer names that starts with the Top 20 Customers by Sales set, then drills down to individual customer names, then to their segment.
Create a custom hierarchy by selecting the Customer Name and Segment dimensions, right-click, hover over “Hierarchy”, and choose “Create Hierarchy…”. Once the custom hierarchy is created, you can drag the Top 20 Customers by Sales set into the hierarchy on the Dimensions Shelf and rearrange them to the desired order of the drilldown. At this point, we see this hierarchy on the Dimensions Shelf.
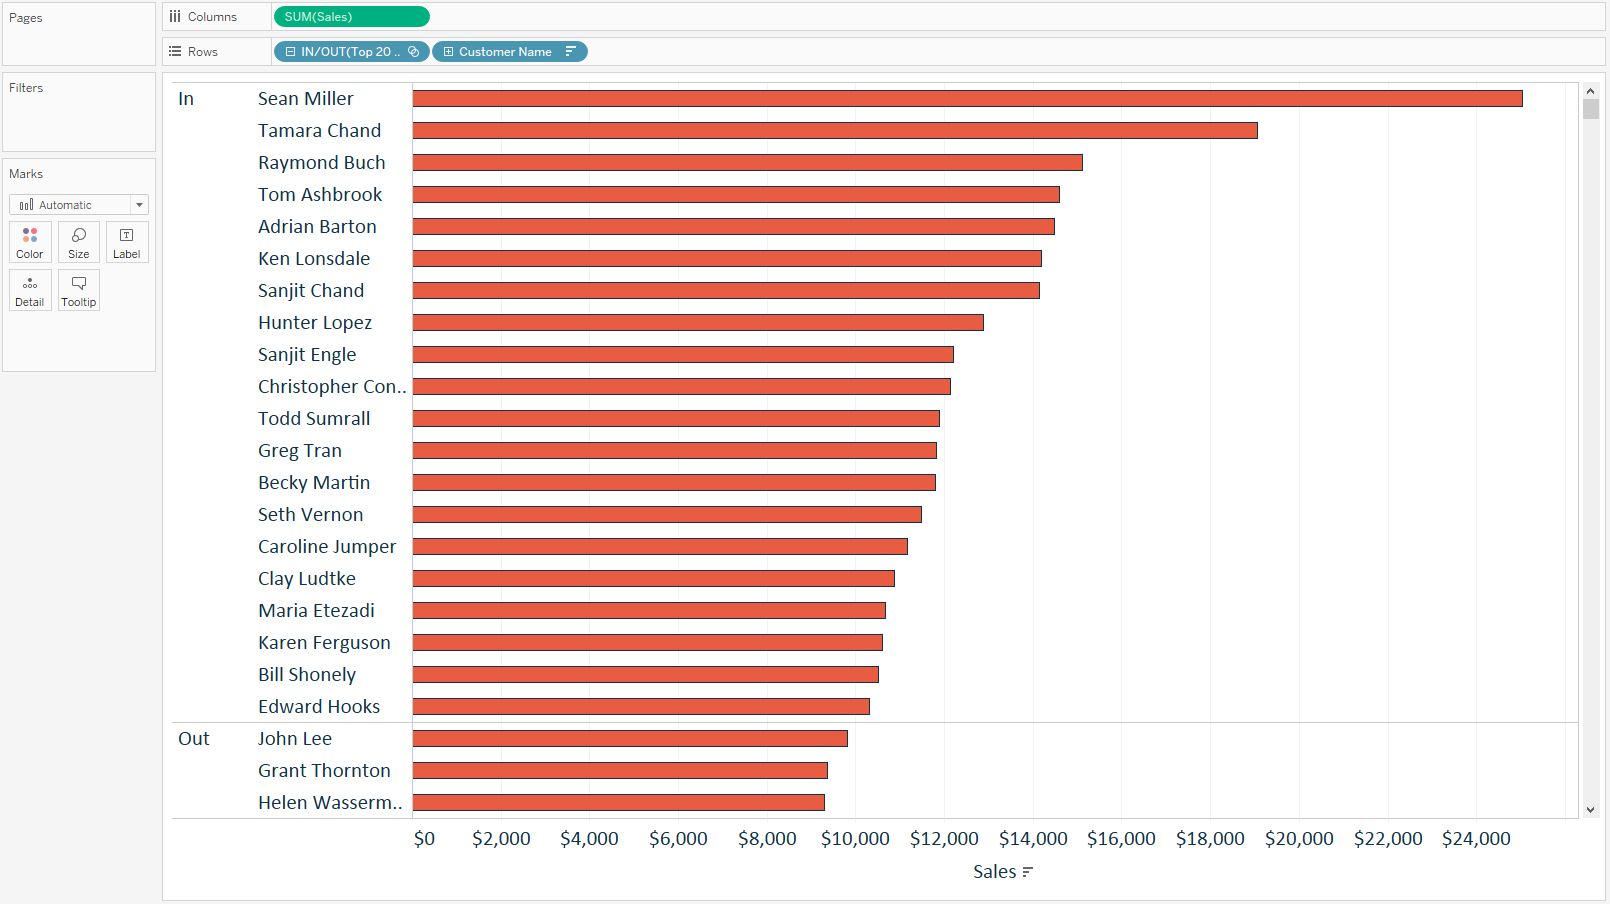
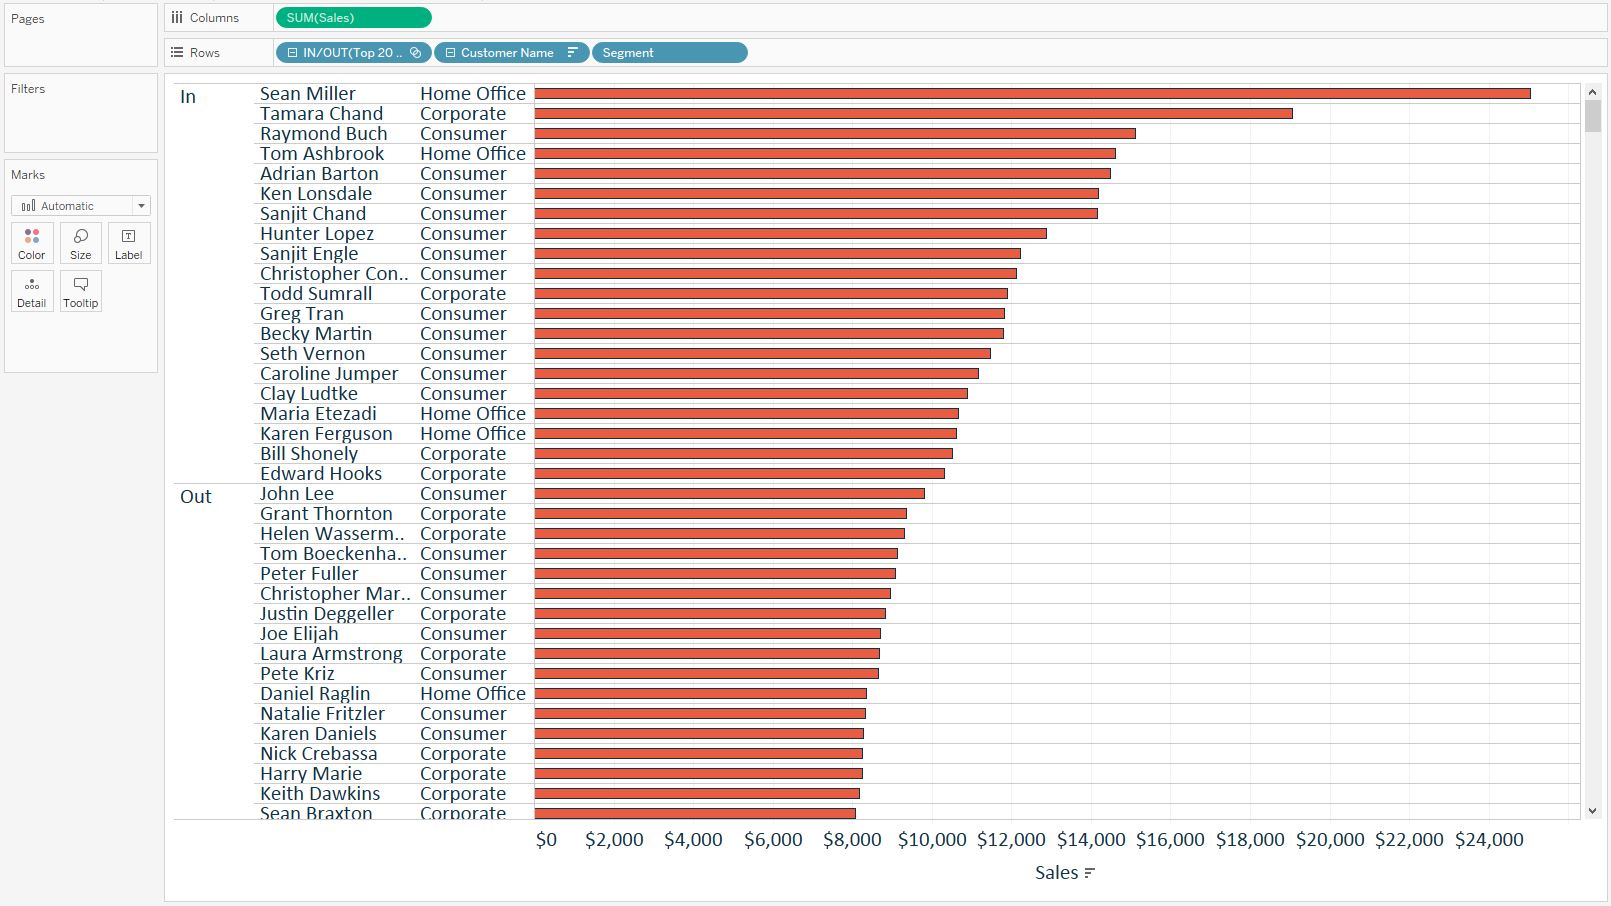
Now that the hierarchy is in place, if we replace the Customer Name dimension with the Top 20 Customers by Sales set dimension in the bar chart example from above, we will be able to drill down from the top 20 set, to customer name, to segment. This is accomplished by clicking the “+” symbol on the field(s) on the Rows Shelf.
Sales by in / out of set.
Sales by in / out of set and customer name.
Sales by in / out of set, customer name, and segment
Written By

Evolytics
This post is curated content from the Evolytics staff, bringing you the most interesting news in data and analysis from around the web. The Evolytics staff has proven experience and expertise in analytics strategy, tagging implementation, data engineering, and data visualization.