
Forbes recently published an article stating that the average data scientist spends about 80 percent of their time preparing data.
That means the average data scientist, or analyst, on your team only spends about one day a week partaking in the activities that truly improve profitability: analyzing data, finding insights, designing actionable tests and putting together a cohesive story for stakeholders.
To make matters worse, after they do finally prepare a package, a question as simple as, “How does this differ across our customer segments?” can send them back to the drawing board, leaving your marketing team with blind spots as the data is re-prepped for more analysis.
Tableau can help your team gain efficiency and improved insights into your business.
Here are the top 5 reasons your company needs Tableau:
1. Less time required to pull and prepare data
The primary goal of any report is for stakeholders to be able to make timely, accurate decisions. Stakeholders must trust the report creator to accurately pull and display information.
If data must be pulled, prepped, and combined manually, the process is time-consuming and vulnerable to mistakes. Tableau’s built-in data connections and preparation tools enable analysts to quickly get data in a usable format.
Time saved preparing data means more time available for your analysts to do what you hired them for: analyzing data and formulating insights.
Is your company’s data in multiple locations or files?
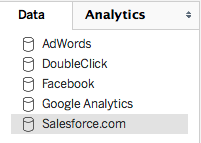
Tableau has over 100 built-in data connections ranging from text files such as Excel to databases like MySQL to online tools such as Google Analytics or Salesforce.com.
Tableau also allows files with the same column names to be combined into one data source. The wide variety of connections allows for multiple data sources to automatically be brought into one central place (no copy and pasting required!).
Once the data is combined in Tableau, rather than having to look through multiple disparate reports to find a story, you can create a single, centralized view.
Does your data require custom joins, calculations or groupings?
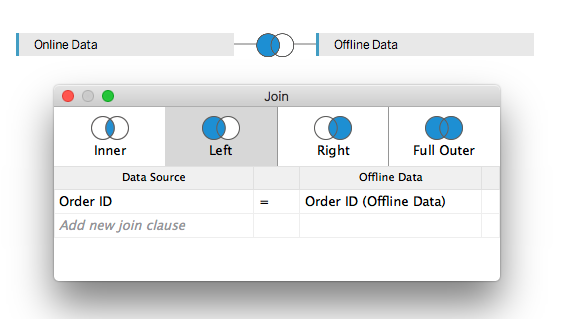
Tableau’s calculation builder allows analysts to create new ways to look at your data quickly and easily.
No need for IT or data engineering involvement to get new fields automatically added to every row. Tableau also allows the ability to create a friendly name for any value without having to change underlying data.
If your data sources have a field in common, Tableau can automatically tie them together. These features empower analysts for in-depth analysis.
Does your company have large amounts of data?
Wrangling large amounts of data is difficult in tools such as Excel, however, if you’ve taken excel training in Denver or elsewhere, it might be an easy job for you. Furthermore, you might need to check the authenticity of data. For example, in a sales-based company, you might need to review all customer details to see if they are accurate. This can be accomplished with the help of a phone number validation tool, which can ensure that your database remains clean.
Tableau has no row limit and allows you to bring in and analyze millions of rows of data. And, it’s designed for scale, so you don’t have to worry about overly-long processing times. All this gives you more comprehensive visibility into your company without eating up resource time.
2. Flexibility to explore and try new things
Most reporting tools require your analyst to know exactly what they’re trying to build before they begin, making initial data exploration a slow process of trial and error.
Tableau’s drag and drop interface allows your analyst to quickly try new ideas, drill into interesting areas and make updates. The ability to rapidly explore and build out visualizations allows for dashboards to provide the most useful and relevant information.
Does your current reporting tool make it cumbersome to explore your data?
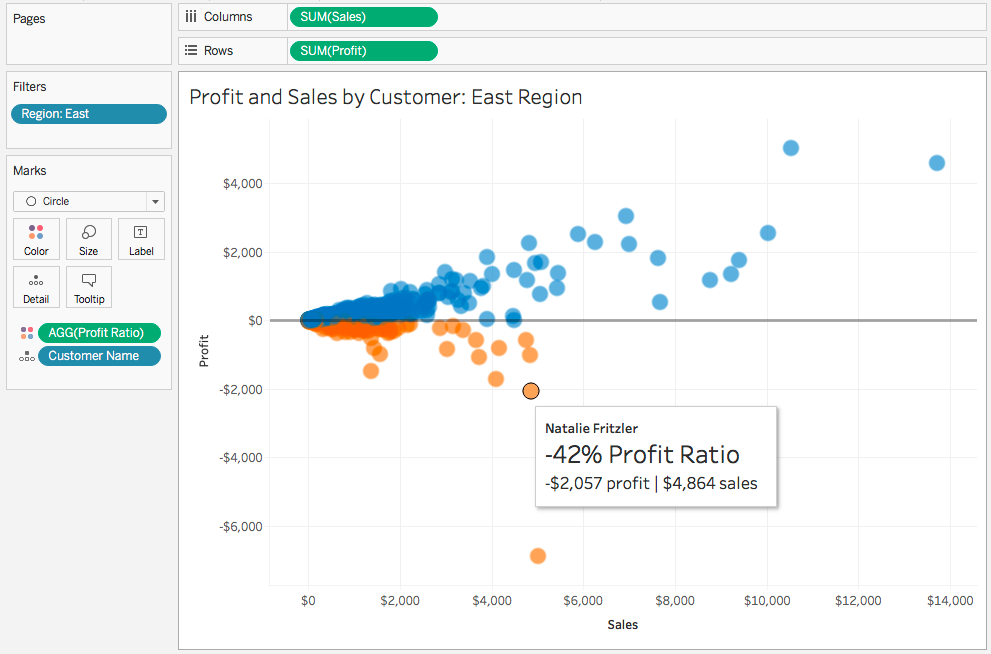
Tableau’s intuitive and easy-to-use interface allows analysts to spend their time finding insights instead of figuring out the technical how-to.
By simply dragging and dropping, your analyst can quickly add different dimensions and measures, filter out or group values, and drill into outliers.
Additionally, features such as clustering, trend analysis, and average lines make it easy to look for patterns in your data.
Do your reports go through multiple revisions?
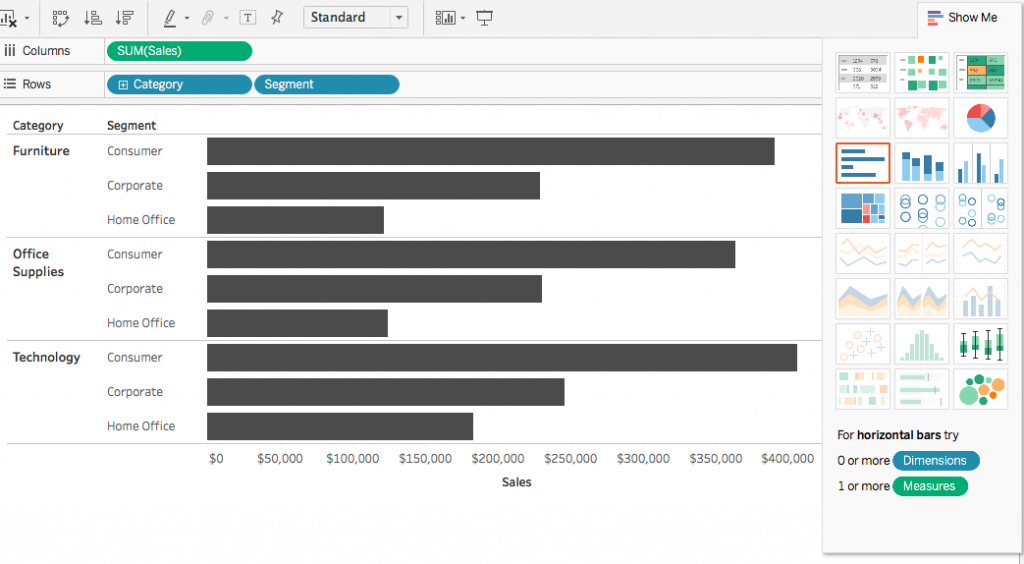
Your report should easily and quickly adapt to your changing business needs. Tableau allows for rapid report development and the flexibility to change report elements.
Tableau’s built in “Show-Me” feature switches between a variety of chart types with one click. No need to reformat data for each chart type or spend hours formatting and aligning items.
Are your stakeholders easily able to gain insights from your reports?
Visualization helps reduce time to insight and allows for the ability to quickly see areas of improvement.
Tableau supports a wide variety of chart types and encoding, such as color-coding or clustering. Dashboards can even be made mobile-friendly for those stakeholders always on the go.
3. Interactivity and segmentation on-the-fly
Often when looking at a report, stakeholders will ask questions like:
- “What does this look like for this customer segment?”
- “Can we change the date range to just see what happened over the last 10 days?”
These are important analysis questions that can often send analysts back to the drawing board, delaying stakeholders getting the information they need.
Tableau allows for stakeholders to interact with and customize the dashboard they are looking at, within the parameters designed by the creator. If you need more information about segmentation in marketing, Qualtrics have written an in-depth guide about it at the previous link.
Do you have separate reports for different segments?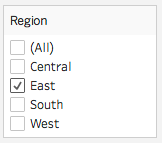
Tableau allows for filters to be added to dashboards. This allows the stakeholder to segment the dashboard down to just the region or brand they manage while still having the ability to understand how other regions are performing.
Filters allow for one dashboard to serve multiple use cases, and allow for additional, on-the-fly discovery and comparison.
Do you want the ability to choose custom date ranges and granularities?
Tableau allows for users to switch between any date range they want to look at. This allows stakeholders to analyze the time period that makes sense for their business question.
Tableau also allows the flexibility to switch between different date granularities, so you can quickly get a daily, weekly, quarterly, or even an all Mondays view.
Do you want to interact with your dashboard?
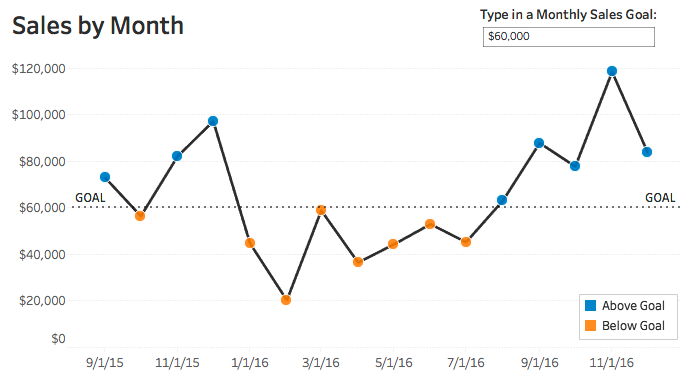
Tableau allows for multiple ways to interact with your dashboard. Clicking a category on a bar chart can filter other charts on the dashboard. Hovering over a data point will show additional information in a “tooltip.”
Tableau also enables interactivity by allowing users to manually input values (such as a goal) to be used in calculations. These options empower your non-analyst dashboard users, helping build a data-driven organizational culture.
4. Share up-to-date dashboards
Sharing dashboards is often done through emailed PDFs. In other words, static representations. In these cases, finding other dashboards or old versions for comparison requires digging through emails or files.
Tableau Server is a product designed to host your company’s dashboards and be a central repository. It allows dashboards to be shared out automatically to stakeholders and allows for stakeholders to favorite certain views, add comments, or edit in the browser.
Do you want to automate your dashboards to always pull in the latest data?
Tableau dashboards can have embedded login information to your company’s data sources. Tableau Server will then pull in the latest data to your dashboard on a set schedule.
Dashboards no longer need to be rebuilt each period, just set them up once and let Tableau Server do the updating!
5. Large online community and commitment to improvement
The Tableau community is full of passionate, knowledgeable individuals who are dedicated to teaching others. Tableau itself is committed to being innovative and listening to the needs of its customers.
Although competition is fierce, and the industry is growing, Tableau has been a leader in Gartner’s Magic Quadrant for seven years in a row.
Do you want to invest in a product that is continually rolling out new features and listens to customer feedback?
Tableau is constantly releasing new versions and features. They are dedicated to R&D and have forums for customers to suggest improvements and new ideas.
When your analysts need help or ideas, wouldn’t it be nice if they could just Google for answers?
There are numerous resources for Tableau help such as free how-to blogs or customized, on-site training. Look at our other blogs on Tableau and the community to learn more.
