Blog


Sharing analytics tips, expert advice and industry insights.

Tableau 201: How to Make Bullet Graphs

How to Make Bullet Graphs is the third of a three-part post from “Use Corporate Chart Types”, tip nine in the Data-Driven Storytelling: Tips from an Iron Viz Champion series. Bullet graphs are a variation of …

Tableau 201: How to Make Small Multiples

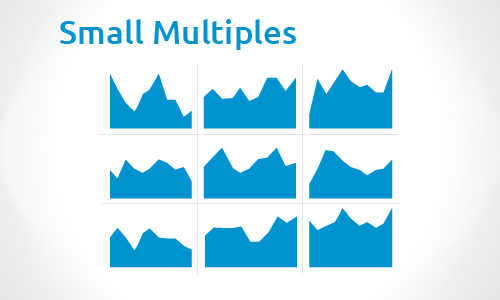
How to Make Small Multiples is the second of a three-part post from “Use Corporate Chart Types”, tip nine in the Data-Driven Storytelling: Tips from an Iron Viz Champion series. Small multiples are a group …

Tableau 201: How to Make Sparklines

How to make sparklines is the first of a three-part post from “Use Corporate Chart Types”, tip nine in the Data-Driven Storytelling: Tips from an Iron Viz Champion series. Sparklines are condensed graphs or charts …

Introducing Tableau 201: A Resource for the Aspiring Data Viz Practitioner

Evolytics recently relaunched the site you are using, and there is now an entire section dedicated to data visualization posts – a perfect place for us to share some of our fun Tableau work, along …

Tableau 201: How to Create Icon-Based Navigation or Filters

In the second of two parts in the Tableau 201: The Making of Odds of Going Pro post, we will show you how to install custom shapes and use the images to filter and navigate dashboards …

Tableau Conference 2014: A Newbie’s Perspective

Am I really at a conference? This thought persisted through former team member Rob Harrison’s mind, throughout the 2014 Tableau Conference. From the moment he entered the building, he could tell this was not a …

Evolytics Speaking at Tableau Conference 14

Evolytics is proud to announce that we will be speaking at the Tableau Conference for the second consecutive year. In fact, you will have two chances to hear from our resident Iron Viz Champion, Ryan …

Data Driven Storytelling: How Tableau’s Iron Viz is an Analogy for Data Visualization

An Analogy for Data Visualization: Tableau’s Iron Viz Championship If you have ever seen me present on the topic of visual analytics, you have heard us use Tableau’s Iron Viz Championship as an analogy for …

Tableau 201: How to Make Funnel Charts

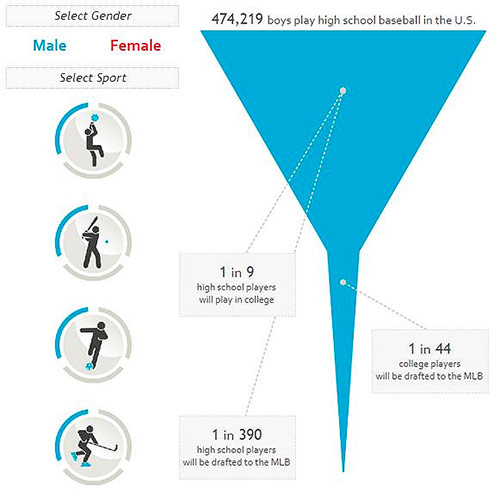
The Odds of Going Pro In Sports viz has generated more questions around how it was created than any other viz in our history of using Tableau. With its one dominant funnel chart and icon-based …

Evolytics Hosting Inaugural Kansas City Tableau User Group

Evolytics is proud to announce that we will be hosting the first Kansas City Tableau User Group meeting on December 5th, 2013. Come to network with fellow Tableau users in the Kansas City area and …