Blog


Sharing analytics tips, expert advice and industry insights.

How to Use Set Controls and Dynamic Zone Visibility to Drive Interactive Insights in Tableau

Creating parameters, filters and base calculations  Set Controls are one of the many powerful functions built into Tableau. They allow users to easily control what data is included or excluded from a set without filtering …

Tableau Visionary Sean Miller joins Evolytics as Associate Director of Data Visualization

Tableau Visionary and Data Visualization expert Sean Miller joins Evolytics as Associate Director of Data Visualization.

How to Compare Current Year Data and Prior Year Data in Tableau

In this tutorial, you will learn how to compare current year data and prior year data in Tableau.

Custom Sorting with Parameters in Tableau

Custom Sorting Options Make Tableau Dashboards More User-Friendly Tableau has made great improvements to its sorting features over the years, such as nested sorting in version 2018.2. This has helped avoid user confusion when sorting, …

How to Synchronize Axes Across Sheets in Tableau

Have you ever needed to show measures from different sheets on the same scale? You might be in this situation if you are leveraging a dual-axis (such as an Index Bullet Chart) and cannot use …

How to Visualize a Reverse Running Total in Tableau

This post will show you how to leverage the custom sorting function of table calculations in Tableau to visualize a reverse running total. For example, you could visualize the number of unique customers who placed …

How to Show YOY Comparison with an Index Bullet Chart in Tableau

In this post, I expand on a previous Tableau tutorial on How to Make Bullet Graphs. I cover a common request we get from clients to show the current year value, prior year value (or goal), …

Converting Non-Date Time Dimensions in Tableau

Date functions are some of the most powerful Tableau features, but what happens when you have a time-based dimension that’s not in a standard date format?  I recently encountered this challenge with a client project. …

Six Favorite Tableau Tips, Tricks and Hacks to Enhance Dashboards

For many companies, Tableau is the data viz tool of choice to monitor and communicate performance in ways that various levels of the organization can quickly and easily understand. At Evolytics, our clients’ needs frequently …

Hacking Cross-Database Unions in Tableau: Use Case Summary and Tutorial

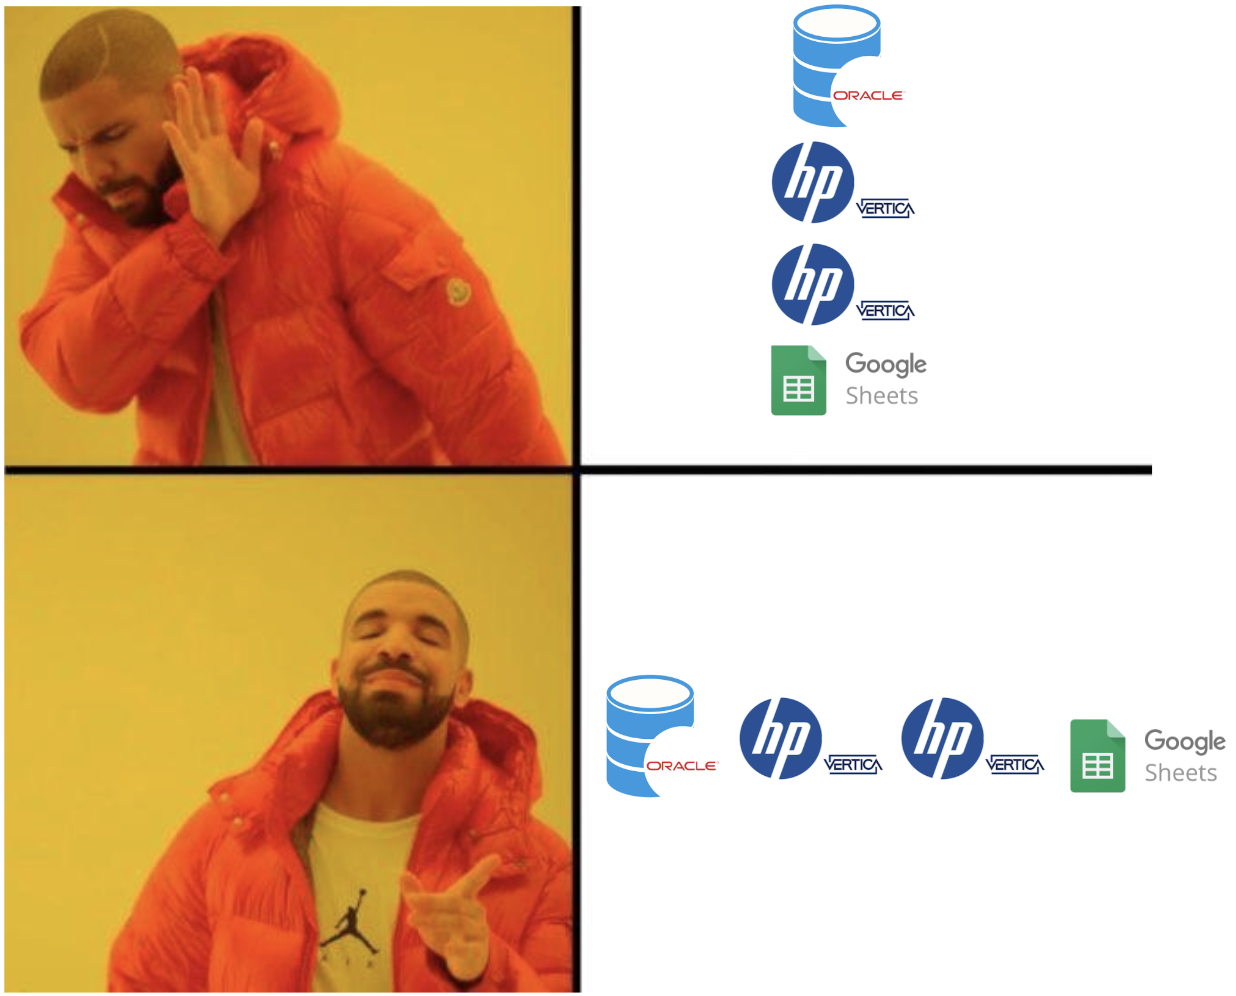
The Challenge: Locating, shaping, and aggregation cross-database data One of our clients needed an executive-level, company-wide dashboard to analyze metrics across all business units and in aggregate for the last two fiscal years. The dashboard …