Possibly the most powerful feature of Tableau is its ability to allow authors to create new data from existing data through calculated fields. Calculated fields can be used to create new dimensions such as segments, or new measures such as ratios. They can also be used with any data type, a multitude of functions and aggregations, as well as logical operators, making the calculated results virtually limitless. This post will introduce calculated fields by walking you through how to create two new measures and one new dimension in the Sample – Superstore data set.
Why use calculated fields?
You may be wondering what’s with all the praise regarding calculated fields? After all, we’ve also suggested that it’s best to prepare your data as much as possible before it gets to Tableau, and that data should include all of the required fields for your analysis. Right?
There are many reasons to leverage the calculated fields functionality in Tableau. Here are just a few:
- To segment your data in new ways on the fly
- To prove a concept such as a new dimension or measure before making it a permanent field in the underlying data
- To filter out unwanted results for better analyses
- To take advantage of the power of parameters, putting choice in the hands of your end users
- To calculate ratios across many different variables in Tableau, saving valuable database processing and storage resources
To bring the concept of calculated fields to life, let’s pretend we are working with the Sample – Superstore data set, and want to evaluate the average order value (AOV) for the product sub-categories we manage compared to the rest of the company. AOV is defined as total sales revenue divided by the number of orders. While this data set has Order ID as a dimension, it does not have the number of orders as a measure, which is the denominator for the AOV calculation.
To isolate the number of orders, we will first create a calculated field to count the number of orders. The formula to count the distinct number of orders will be COUNTD of the Order ID dimension. To start a calculated field, you can either:
- Click the down arrow in the top-right corner of the Dimensions Shelf and pick “Create calculated field…”
- Right-click a blank space on the left sidebar and choose “Create calculated field…”
- Click Analysis in the top navigation and choose “Create Calculated Field…”
- Right-click on one of the fields you want to use as part of your calculated field, hover over “Create”, and choose “Calculated field…”
For this first calculated field, because we know that we need the Order ID as part of the calculated field, we will start the calculated field by right-clicking on the Order ID dimension on the Dimensions Shelf, hovering over “Create”, and clicking “Calculated field…”. This opens a new dialog box where we can enter the formula for my calculated field:
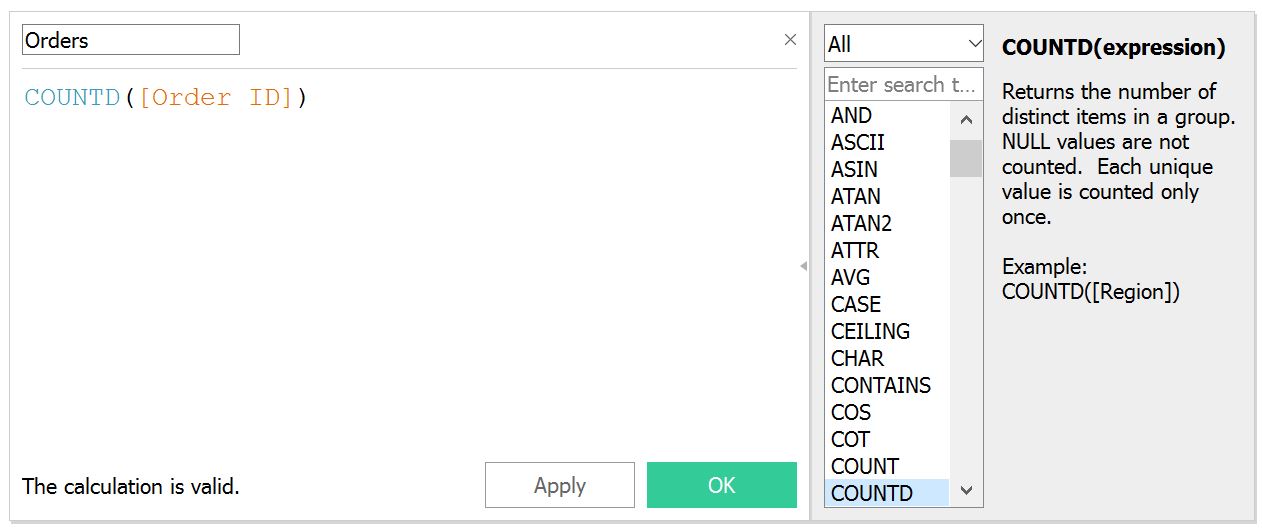
On the right-hand side of the calculated field dialog box there is a definition of the COUNTD expression. Any time you see a blue color-coding when creating a calculated field, you can click on the blue-colored word to get a definition and example of that particular function; this is a great way to learn the syntax. After clicking the OK button, you will see a new measure for Orders appear on the Measures Shelf – a brand new measure that we can now use throughout the workbook!
Now that we have our Orders measure, which is the denominator of the AOV calculation we’re after, we can create another calculated field to calculate the total sales revenue divided by the number of orders. To start this calculated field, right-click on a blank space in the left sidebar and choose “Create calculated field…”. We’re presented with a blank calculated field dialog box where we can enter the formula for AOV:
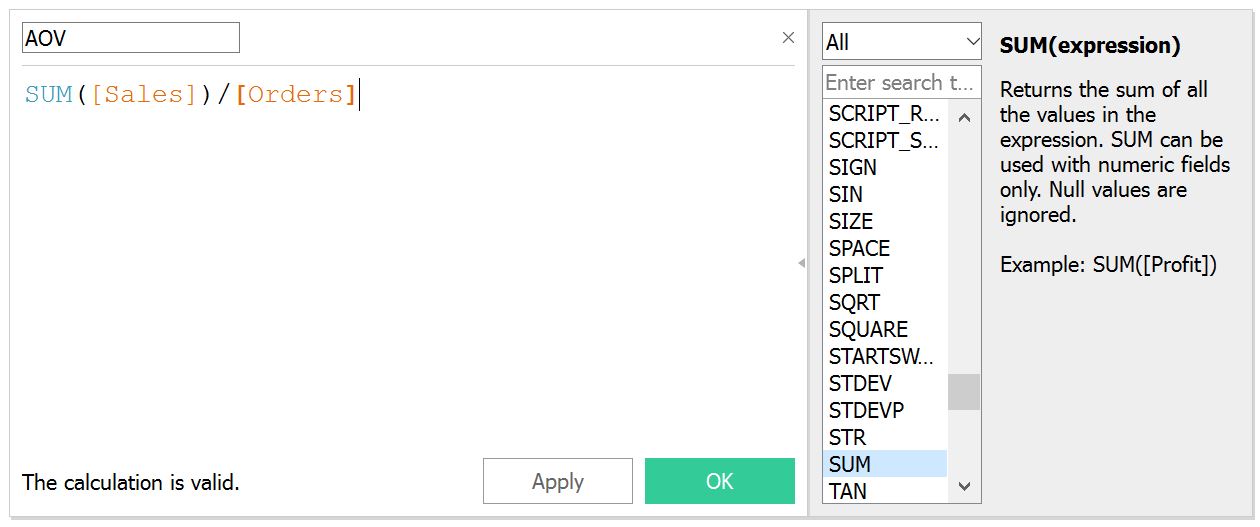
Notice this time that the measure of Sales is aggregated as SUM, but Orders appears to have no aggregation. That’s because Orders already has an aggregation of COUNTD in the underlying calculated field that we created in the previous step. Tableau does not allow you to mix aggregated and non-aggregated fields within a calculated field. If you create an invalid calculated field, Tableau will display a red indicator at the bottom of the dialog box that reads “The calculation contains errors”. You can click on the error message to be provided with a clue for what may be wrong with your calculation.
Also remember that even when Tableau says that a calculation is valid, that’s in terms of the syntax, and not in terms of the result you are looking for. To quality check a calculated field and ensure it’s properly calculating the result, we like to put the raw ‘ingredients’ on the view and calculate the answer manually. In the case of this tutorial, we would create a quick table showing orders, sales, and the newly created AOV measure. We would then divide the sales amount by the number of orders to make sure the correct answer is reflected as AOV.
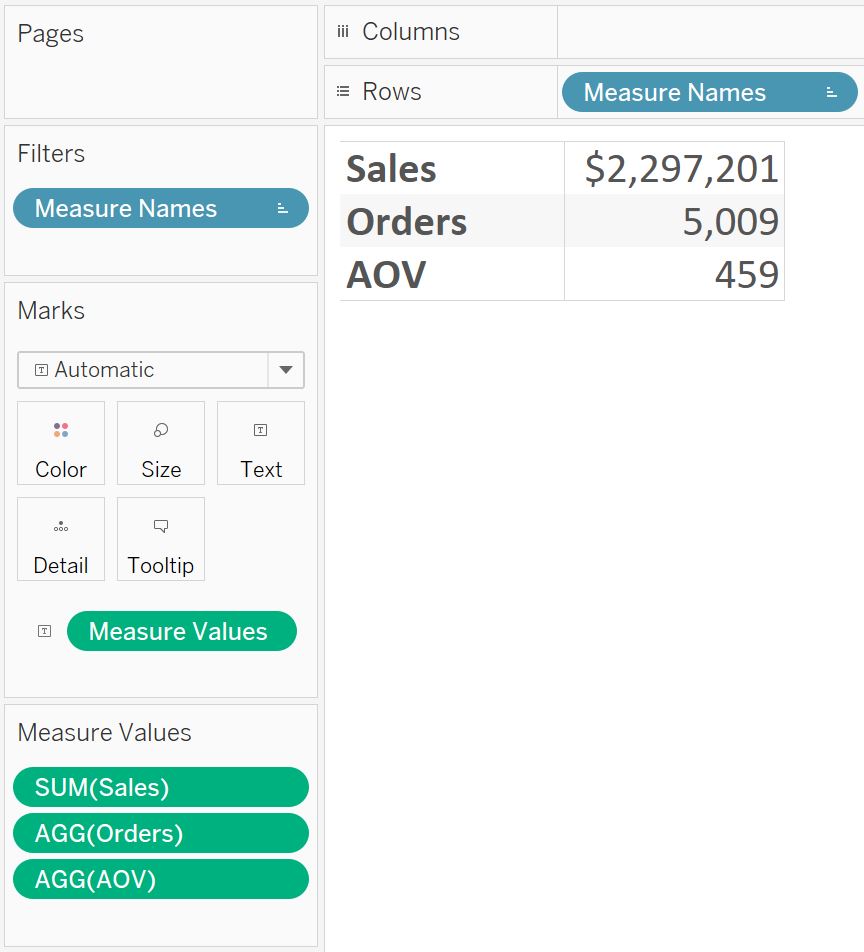
Based on the image above, it looks like Tableau has calculated the correct answer: $2,297,201 in total sales divided by 5,009 total orders equals an average order value of $459. By default, calculated fields do not receive number formatting. In the case of AOV, which should be displayed as a currency, this can be changed by right-clicking on the calculated field on the Measures Shelf, hovering over “Default properties”, and clicking “Number format…”.
More on Aggregating Calculated Fields
Aggregation, introduced in the post, 5 Ways to Make a Bar Chart / An Introduction to Aggregation, is an important concept to consider when creating calculated fields. A calculated field for SUM([Profit]) / SUM([Sales]) will give you a very different answer than [Profit] / [Sales], even though both formulas are valid. If you do not provide the aggregation within the calculated field, Tableau will calculate the equation for every record in your analysis, then aggregate the answers for all of the rows together when the calculated field is added to the view. It is critical to quality check calculated fields and ensure you are seeing expected results before integrating the new measures in your work.
To this point, we’ve created a new measure for Orders and used the Orders measure within a second new calculated field for AOV. Now let’s put the new fields to work by answering our business question: What is the AOV of the product subcategories we manage compared to everything else? For the purposes of this illustration, we’ll pretend that we manage the Copiers, Machines, and Supplies subcategories. To answer this question, we will create a third calculated field, this time creating a new Sub-Category Segmentation dimension.
This calculation is slightly different in that we will be incorporating IF / THEN logic to create a segmentation: one segment for the sub-categories we manage (Copiers, Machines, and Supplies) and the other segment for every other sub-category. The formula looks like this:
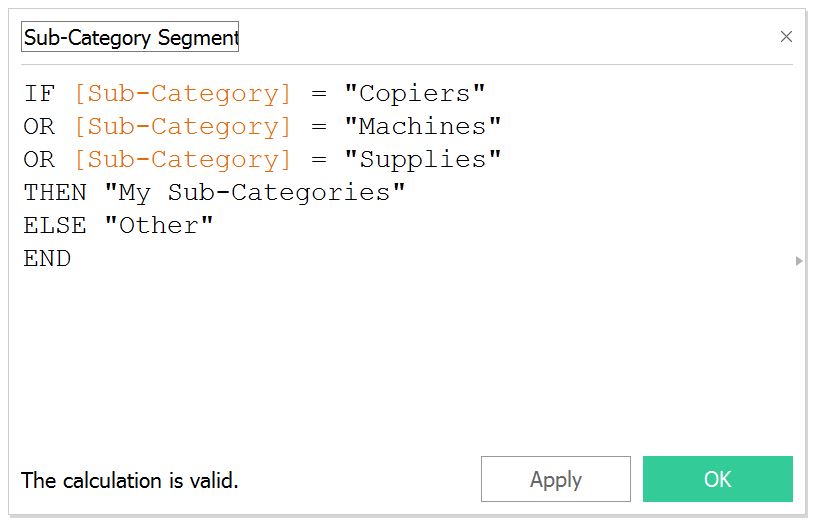
All this calculation is saying is that if the dimension member of Sub-Category matches copiers, machines, or supplies, we want the data to be classified as “My Sub-Categories”. If the dimension member is anything other than those three, we want the data to be classified as “Other”. To quality check a dimension calculation such as this one, we like to first place the original dimension on the rows shelf, followed by the newly created calculated field to make sure the dimension members are being properly calculated:
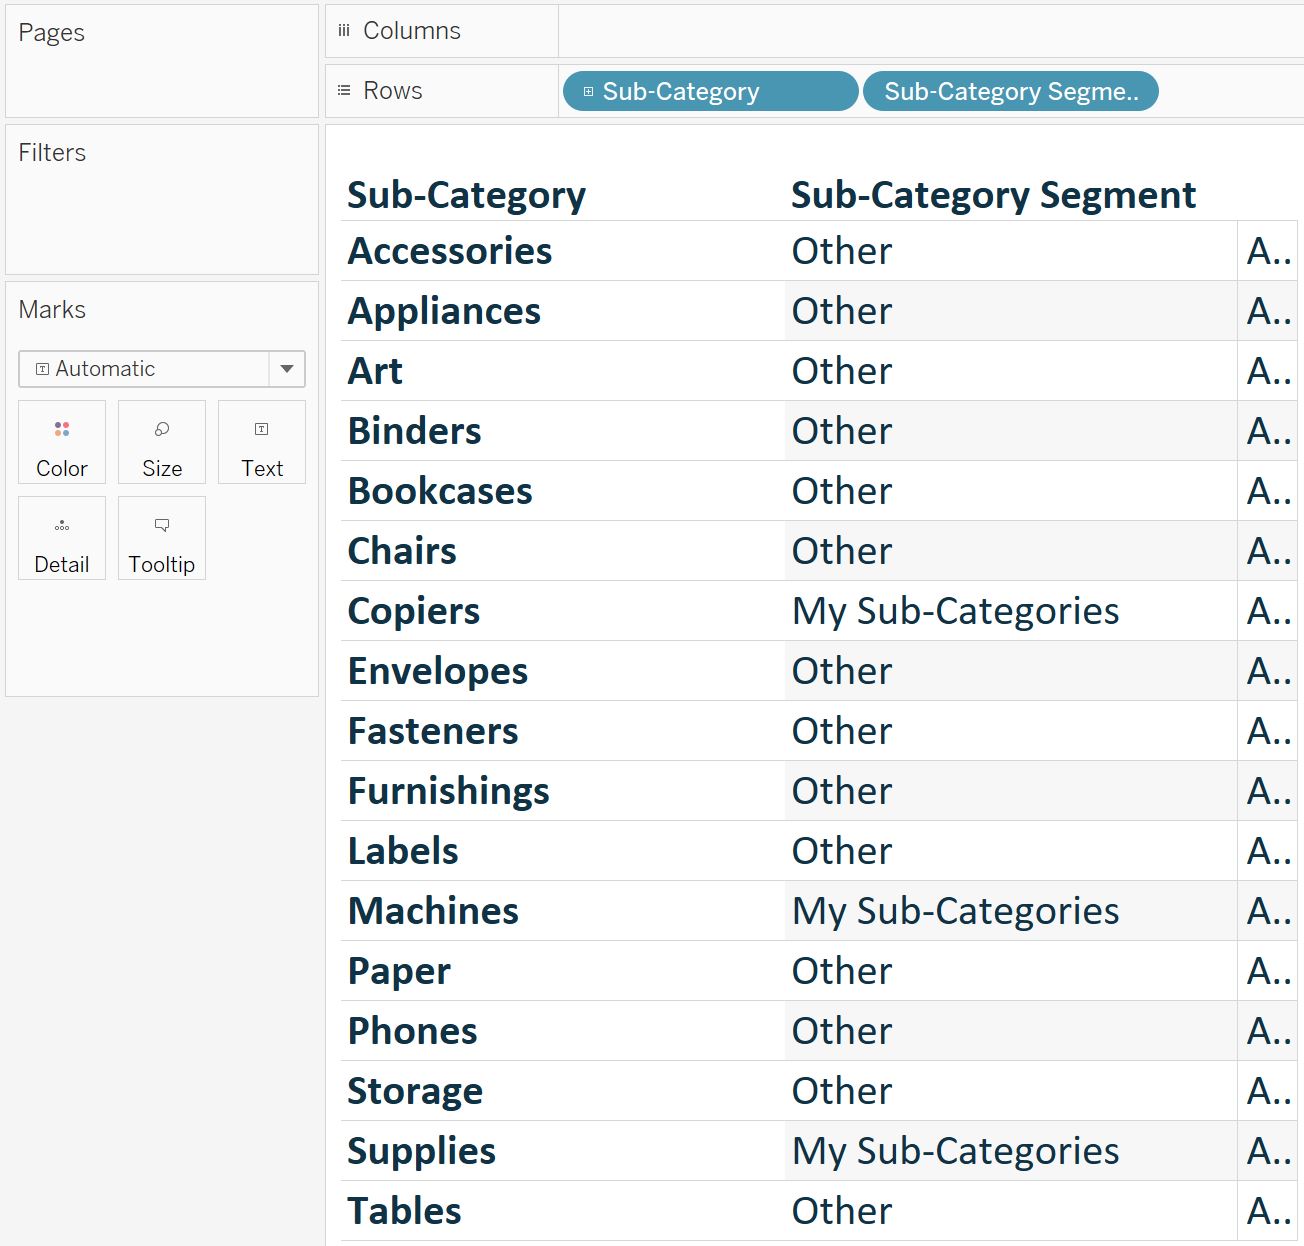
As you can see, my three sub-categories are classified as “My Sub-Categories” in the second column, and everything else is classified as “Other”.
We’re now ready to answer our business question by putting the AOV calculated field on the view, then slice and dice the measure by the Sub-Category Segment dimension:
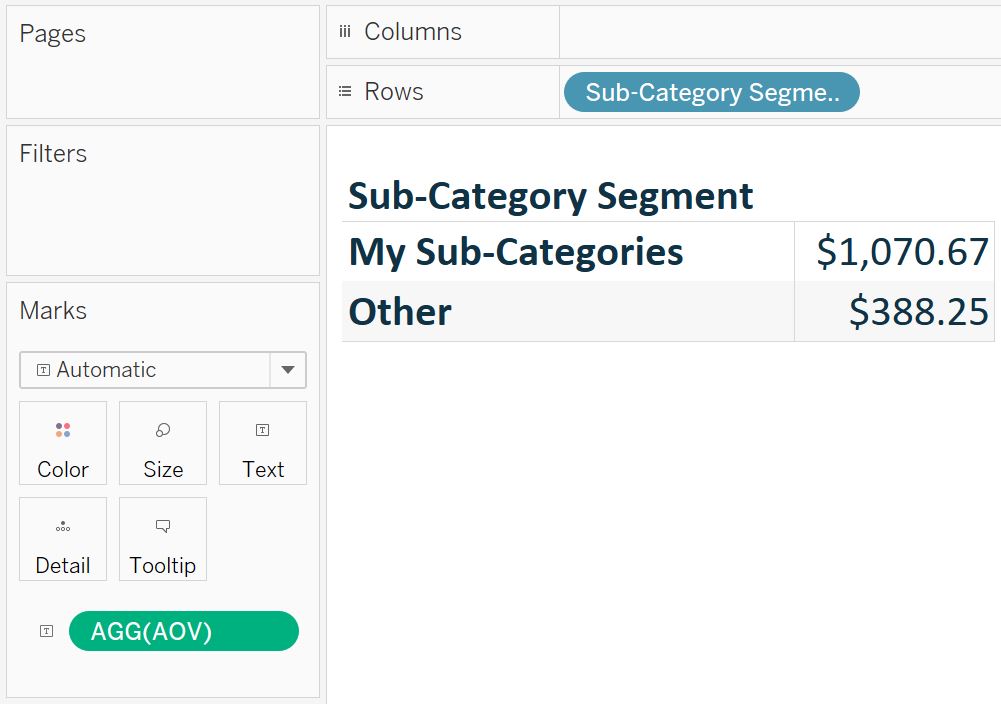
The answer clearly shows the AOV for the product subcategories that we manage is much higher than the AOV for all of the other subcategories – maybe it’s time we ask for a bonus!
Written By

Evolytics
This post is curated content from the Evolytics staff, bringing you the most interesting news in data and analysis from around the web. The Evolytics staff has proven experience and expertise in analytics strategy, tagging implementation, data engineering, and data visualization.